Share Market
Wall Street Week Ahead for the trading week beginning August 3rd, 2020
Good Saturday morning to all of you here on r/stocks. I hope everyone on this sub made out pretty nicely in the market this past week, and is ready for the new trading month ahead.
Here is everything you need to know to get you ready for the trading week beginning August 3rd, 2020.
Earnings and fiscal debate could be catalysts for stocks in the week ahead - (Source)
The market could lose some of its exuberance in the week ahead as the calendar turns to August, and investors await Friday’s July employment report and keep their eyes on Washington.
The focus will also be squarely on politicians, as Congress struggles to find a middle ground on a new fiscal spending package and decide the fate of the $600 a week unemployment supplement that was set to expire July 31. Former vice president Joe Biden is also expected to name his running mate in the coming week.
The jobs data will be crucial, particularly since the number of people filing for unemployment benefits has been edging higher, instead of falling back, as expected. According to Refinitiv, about 1.36 million new jobs are expected, well below the 4.8 million added in June, and the unemployment rate is expected to fall to 10.7% from 11.1%.
Trading around the report could be volatile, since some economists expect more than 2 million jobs were added, and some even see flat or negative payrolls.
Stocks have done well for the month of July, with the S&P 500 finishing at 3,271, a gain of 5.5%. The Nasdaq has performed the best, rising 6.8% for the month to 10,745, after a 3.7% gain for the past week.
“August has traditionally been a challenging month for investors,” said Sam Stovall, chief investment strategist at CFRA. The market is entering what historically has been the worst two months for stocks.
According to Stovall, the S&P 500 has been higher in August 53% of the time, and its average move is a gain of just 0.01%, going back to World War II. September is worse, down 0.51% on average, and up just 48% of the time.
In presidential election years, however the odds for August gains are better, as it rose 63% of the time and 73%, when the incumbent is up for re-election.
There are also about 120 S&P 500 companies reporting earnings, but the big earnings show for markets was this past week when four of the five biggest tech giants all reported Thursday afternoon. Three of those stocks — Apple, Amazon and Facebook — surged, helping Nasdaq outperform Friday with a more than 1.5% gain.
Earnings scorecard
“We’re only a month into the reporting period, and things are going to become less and less important from an earnings perspective,” said Stovall. “I think investors are sort of disappointed in that the bar was set so low for second quarter earnings that expectations were that we were going to see a lot of companies beat, which we have. But we were also going to see a gradual uplift of earnings expectations for forward quarters. We’re not seeing that.”
Eighty-two percent of the companies reporting so far have beaten estimates, well above the average 65%, according to Refinitiv. The earnings decline is now looking closer to 33% from an initial 40%, and tech, which has been leading the market is one of the best performers. Profits for the sector now look to be up 1.4%, according to I/B/E/S data from Refinitiv.
Because the tech names have contributed so much to market gains, their earnings were an important test for the market, and they didn’t disappoint. But they didn’t manage to pull up the whole market very far on Friday.
Among the names reporting in the coming week are a diverse group, including Disney, ViacomCBS, Bristol-Myers Squibb, Berkshire Hathaway, AIG, Clorox, and Wayfair, to name a few.
Politics now in play
“The earnings story is over. My call had been once we had gotten through the earnings season, we would be more vulnerable to a sustainable pullback,” said Barry Knapp, Ironside Macroeconomics managing partner and director of research. “Obviously, it’s volatility season, but it’s also an election year. … We’re more vulnerable to that next week and earnings won’t hold us up.”
Knapp said if President Donald Trump and Republicans do not begin to perform better in the polls by Labor Day, the market is likely to focus on what a Democratic win would mean for taxes and regulation. That could be a negative for stocks.
“If he hasn’t made headway by then, it’s likely he’s done.That’s about the point when things become pretty set in stone. The market will presume that’s the case,” Knapp said.
The politics of the stimulus package could also reverberate through markets, until it looks like the Senate Republicans and House Democrats can find common ground.
The two sides look to be at a standoff, but an agreement is still expected in early August. The market is particularly watching to see what happens with the enhanced unemployment benefits. Republicans have proposed cutting it to $200, but Democrats support keeping it.
The economy
Cutting the size of the payments back might be good for the labor market and persuade more workers to return to work, some strategists say. However, there is also concern that the funding has helped stimulate the economy and keep the unemployed from defaulting on loans and payments. Consumer spending on goods in June was even higher than last year, and that was also seen as getting a lift from stimulus.
Besides the jobs report, there are other important data like ISM manufacturing on Monday. There are also monthly vehicle sales Monday, and ISM nonmanufacturing data Wednesday.
“I think the macro data is going to be fine next week,” said Knapp. “I’m not in the camp that thinks the payroll number is going to be negative.”
NatWest Markets economist Kevin Cummins is one of the economists who expects the jobs gains to be much smaller than the past two months. He expects the payrolls to come in at just 200,000. “You look at jobless claims, and you see a stalling out,” he said. “The Fed is right. There is significant downside risk to the economy.”
A trade to watch
Treasury yields, in the 2-year to 7-year range, fell to new lows in the past week. The 10-year yield, not yet at a record low, was also falling and was at 0.53% Friday. At the same time, the dollar was down more than 1% on the week and 4% for the month.
Gold was a beneficiary of the lower interest rates, weaker dollar trade, rising about 5% for the week and 10% for the month.
Strategist say investors are reacting to super-low interest rates, concerns about the economy, and the possibility that huge government spending will send inflation higher.
Investors are also jumping into inflation-protected bonds. According to Refinitiv’s Lipper, inflation-protected bond funds took in $271 million of net new money for the fund-flows week ended July 29, the sixth week of gains. About $1 billion went into the SPDR Gold Shares ETF, (GLD) in the last week, Lipper said.
During this time period, the Treasury Inflation-Protected Securities funds recorded their two best weekly net inflows ever with increases of $1.9 billion and $1.5 billion, respectively, for the fund-flows weeks of June 24 and July 1.
Lipper said investors started to put money into TIPS funds in the middle of the second quarter, and the flows have been . net positive in 11 out of 13 weeks since the beginning of May. This its second-worst quarterly net outflows ever as oil prices slumped in the first quarter.
“I think this is going to be a much more inflationary decade. It will start out slowly. [Fed Chairman Jerome] Powell is right that more forces are putting downward pressure on inflation at present. But the market looks past that,” said Knapp. “The big story in 2021 will be the recovery of inflation. You’re already seeing it in import prices.”
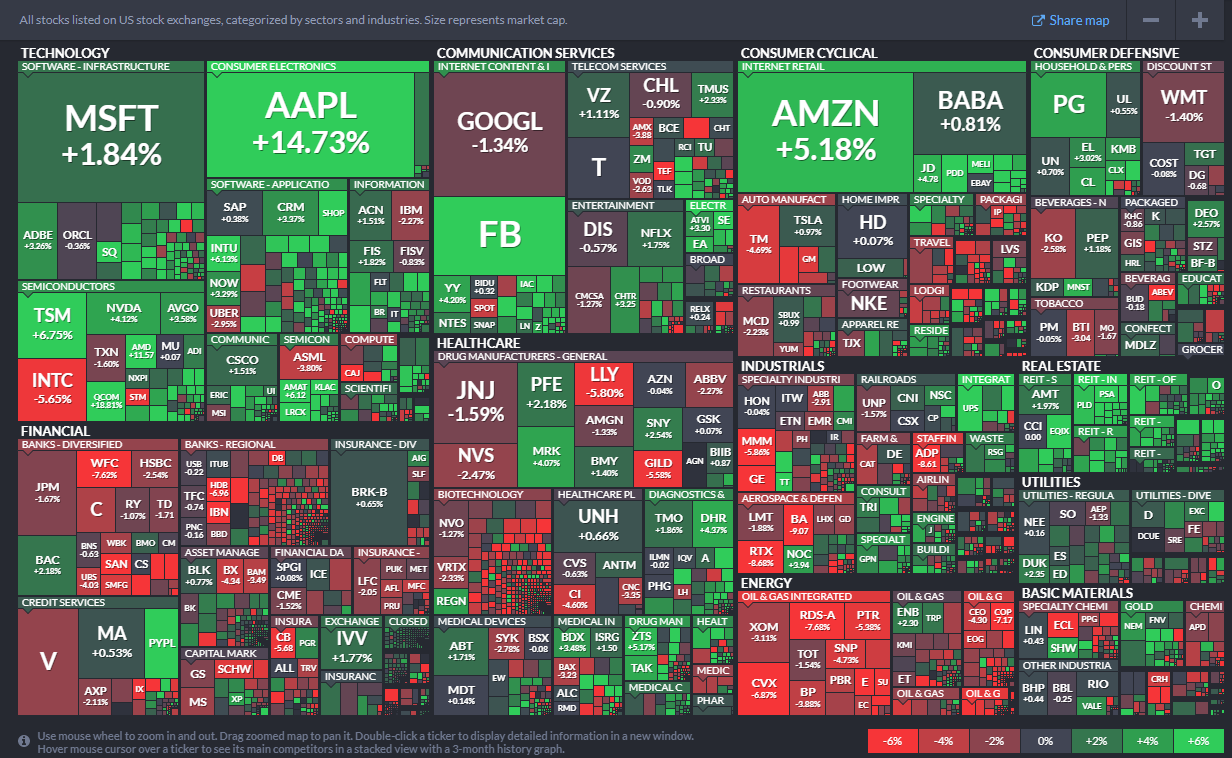
This past week saw the following moves in the S&P:
(CLICK HERE FOR THE FULL S&P TREE MAP FOR THE PAST WEEK!)
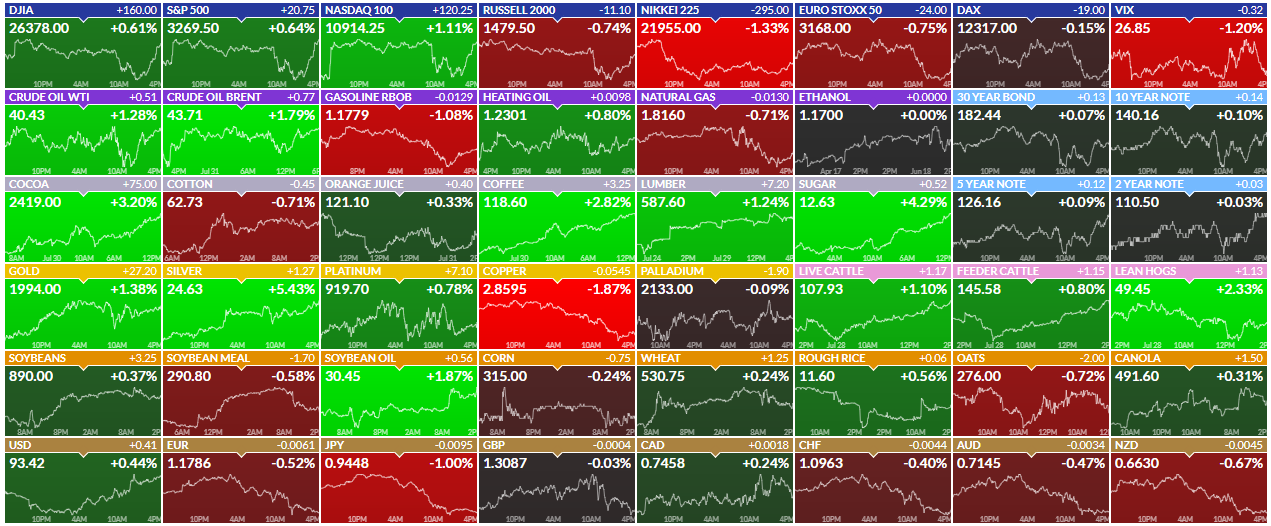
Major Indices for this past week:
(CLICK HERE FOR THE MAJOR INDICES FOR THE PAST WEEK!)
Major Futures Markets as of Friday's close:
(CLICK HERE FOR THE MAJOR FUTURES INDICES AS OF FRIDAY!)
Economic Calendar for the Week Ahead:
(CLICK HERE FOR THE FULL ECONOMIC CALENDAR FOR THE WEEK AHEAD!)
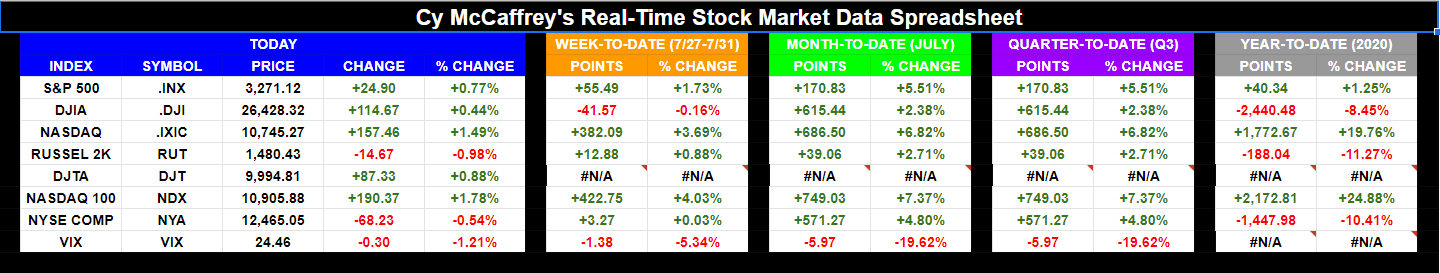
Percentage Changes for the Major Indices, WTD, MTD, QTD, YTD as of Friday's close:
(CLICK HERE FOR THE CHART!)
S&P Sectors for the Past Week:
(CLICK HERE FOR THE CHART!)
Major Indices Pullback/Correction Levels as of Friday's close:
(CLICK HERE FOR THE CHART!
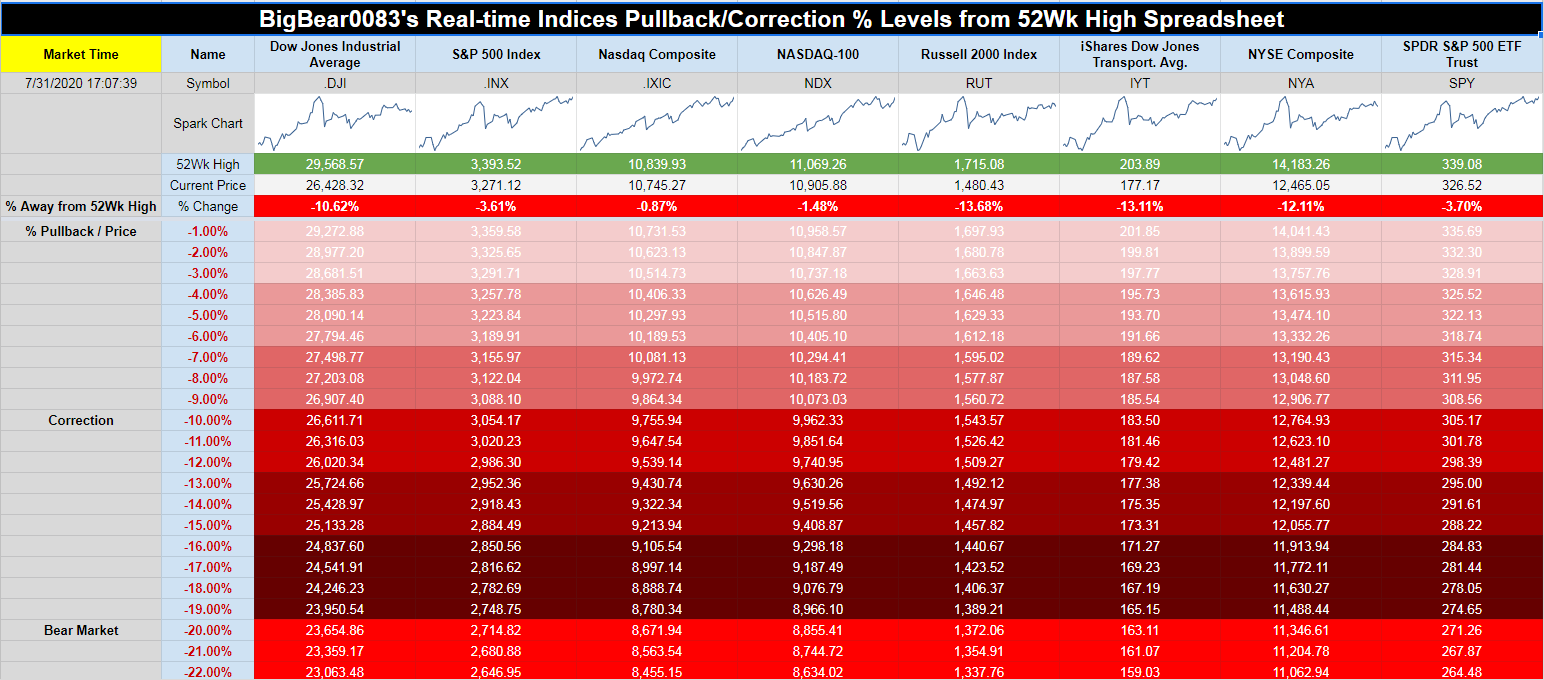
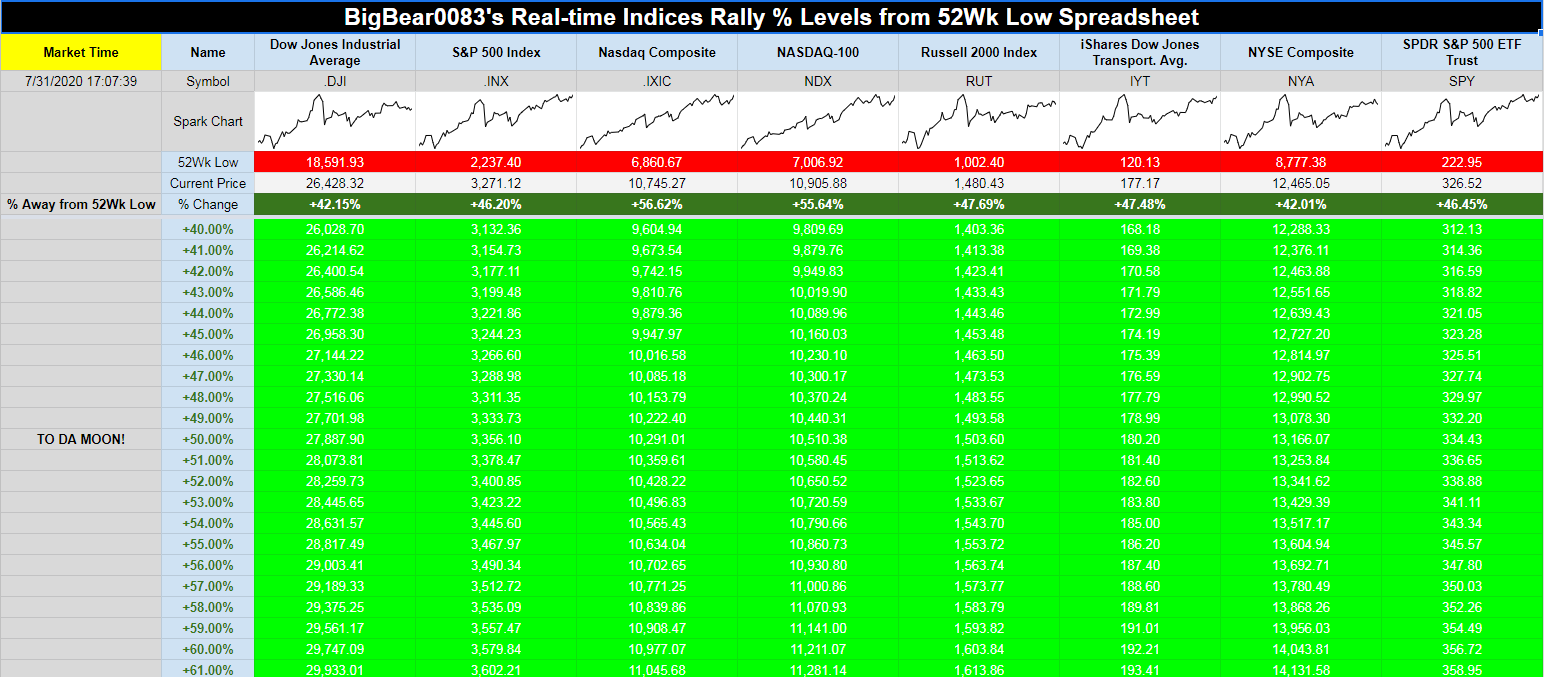
Major Indices Rally Levels as of Friday's close:
(CLICK HERE FOR THE CHART!)
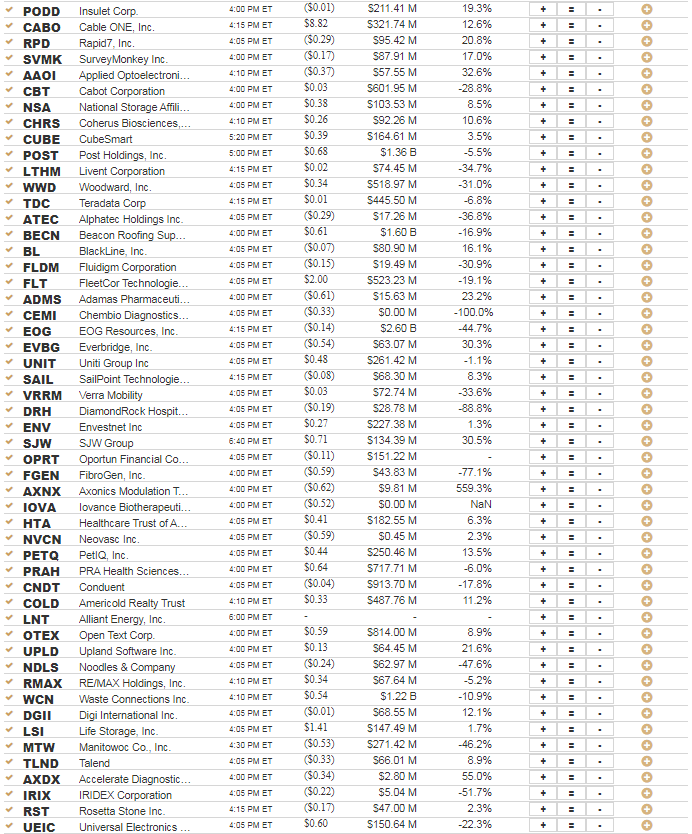
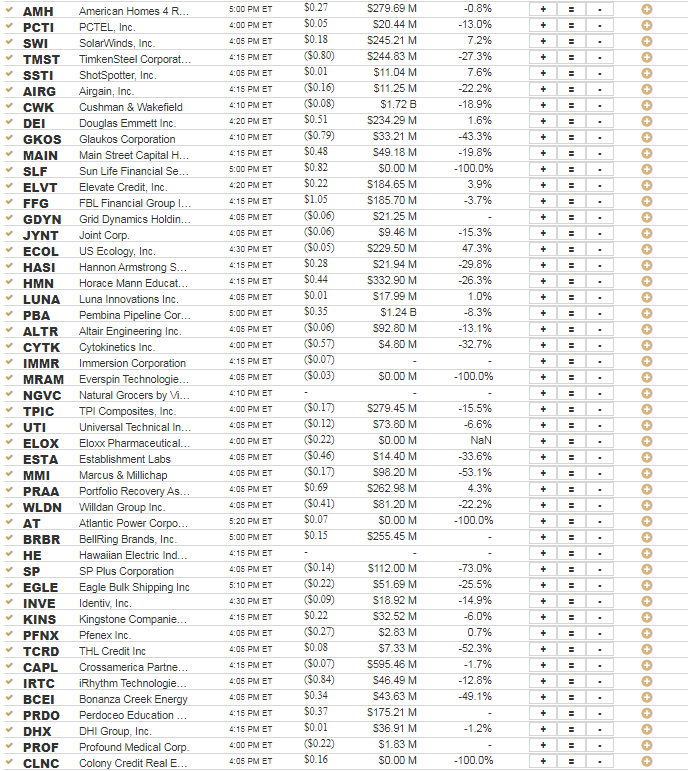
Most Anticipated Earnings Releases for this week:
(CLICK HERE FOR THE CHART!)
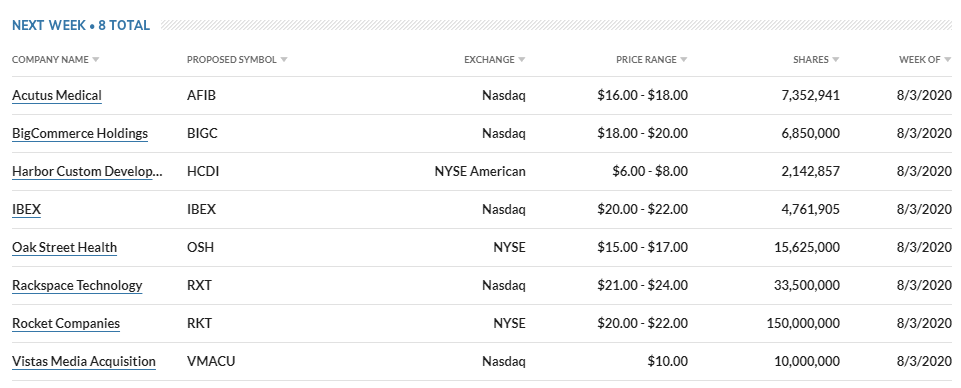
Here are the upcoming IPO's for this week:
(CLICK HERE FOR THE CHART!)
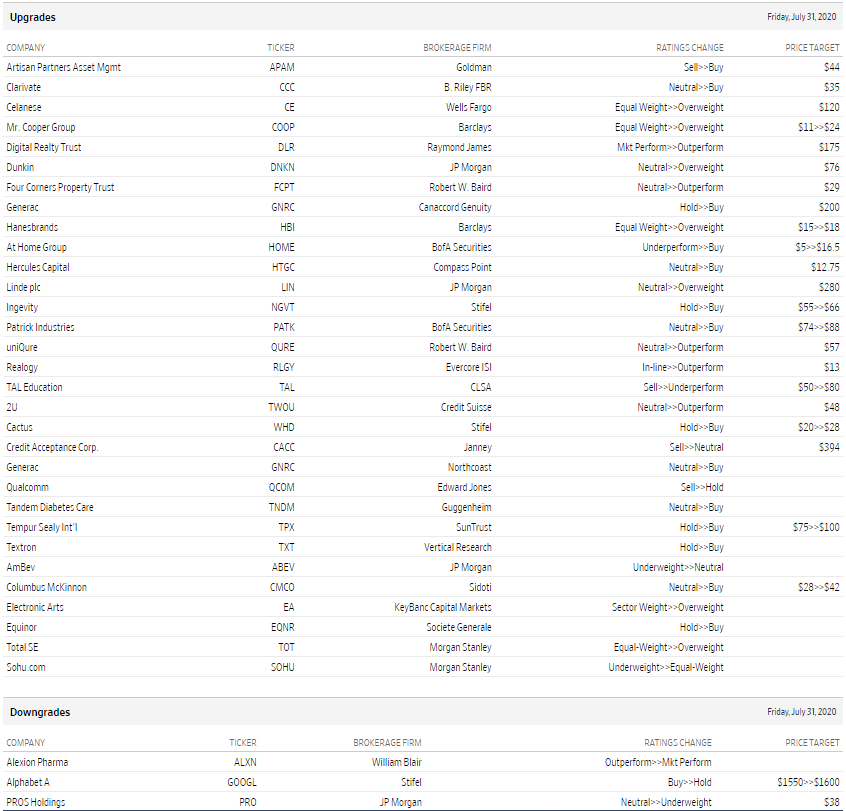
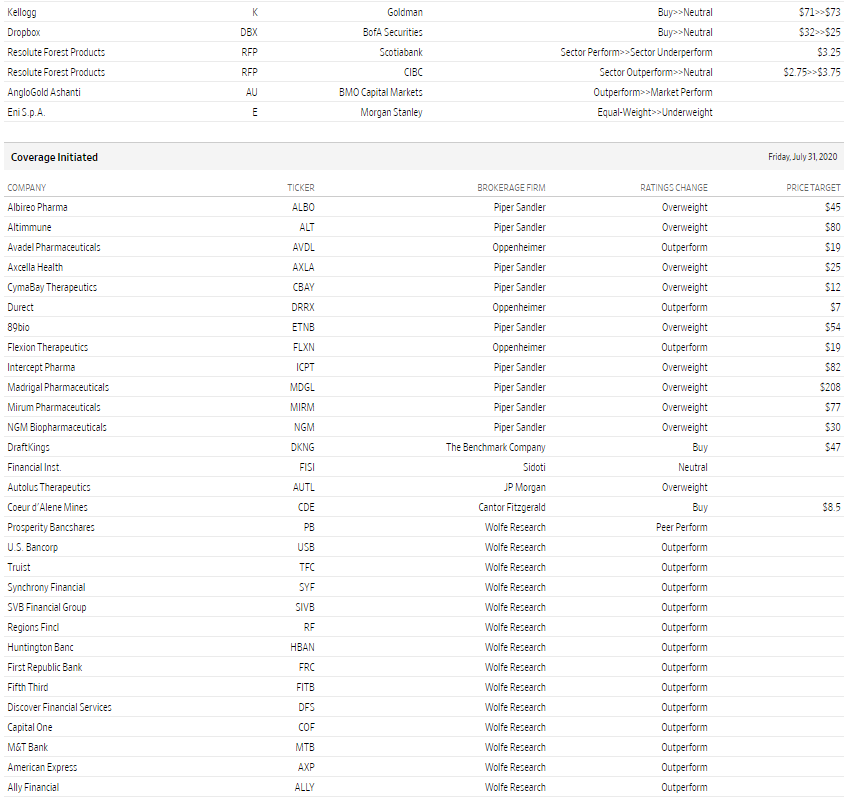
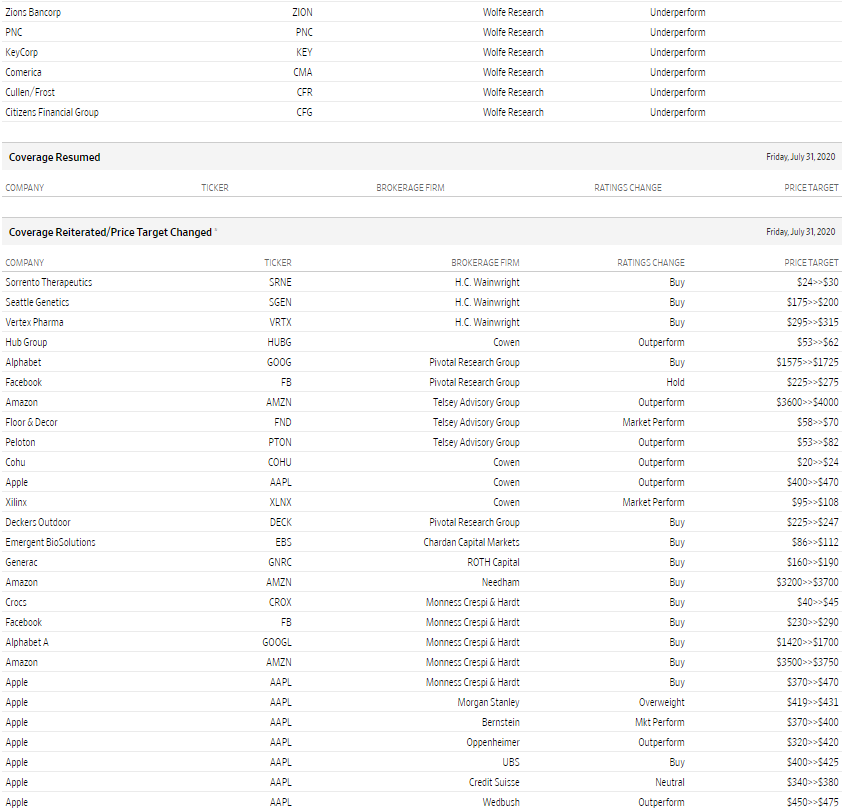
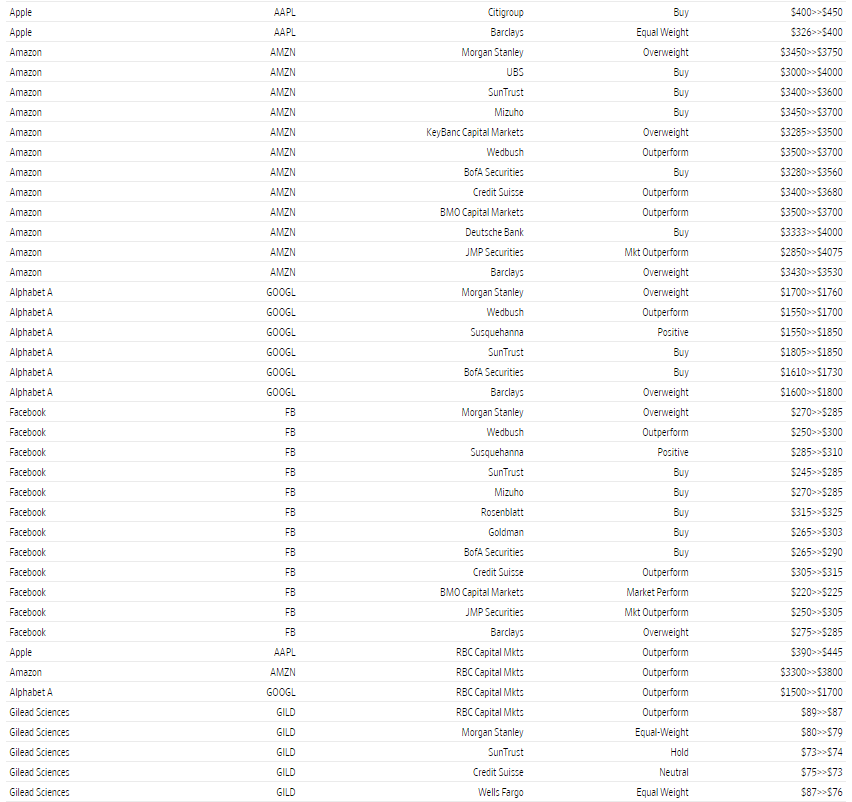
Friday's Stock Analyst Upgrades & Downgrades:
(CLICK HERE FOR THE CHART LINK #1!)
(CLICK HERE FOR THE CHART LINK #2!)
(CLICK HERE FOR THE CHART LINK #3!)
(CLICK HERE FOR THE CHART LINK #4!)
(CLICK HERE FOR THE CHART LINK #5!)
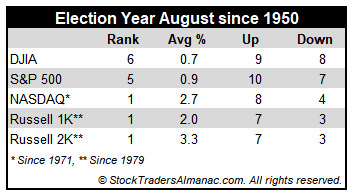
August: Top NASDAQ & Russell 2000 Month of Election Years
August is amongst the worst months of the year. It is the worst DJIA, S&P 500, NASDAQ, Russell 1000 and Russell 2000 month over the last 32 years, 1988-2019 with average declines ranging from 0.1% by NASDAQ to 1.1% by DJIA.
Contributing to this poor performance since 1987; the second shortest bear market in history (45 days) caused by turmoil in Russia, the Asian currency crisis and the Long-Term Capital Management hedge fund debacle ending August 31, 2020 with the DJIA shedding 6.4% that day. DJIA dropped a record 1344.22 points for the month, off 15.1%—which is the second worst monthly percentage DJIA loss since 1950. Saddam Hussein triggered a 10.0% slide in August 1990. The best DJIA gains occurred in 1982 (11.5%) and 1984 (9.8%) as bear markets ended. Sizeable losses in 2010, 2011, 2013 and 2015 of over 4% on DJIA have widened Augusts’ average decline.
(CLICK HERE FOR THE CHART!)
However, in election years since 1950, Augusts’ rankings improve: #6 DJIA, #5 S&P 500, #1 NASDAQ (since 1971), #1 Russell 1000 and #1 Russell 2000 (since 1979). This year, the market’s performance in August will likely depend heavily on how July closes and whether or not the rate of covid-19 infection continues to accelerate which could force some areas to roll back reopenings.
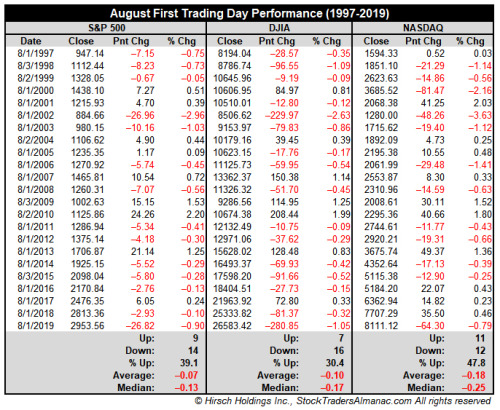
August’s First Trading Day Bearish Last 23 Years
From the Stock Trader’s Almanac 2020 (page 88), it is known that the first trading days of each month combined gain nearly as much as all other days combined. However, the first trading day of August does not contribute to this phenomenon ranking worst among other First Trading Days in the 2020 Almanac. In the past 23 years DJIA has risen just 30.4% (up 7, down 16) of the time on the first trading day of August. Average and median losses are on the mild side due to a few sizable advances. Over the past nine years, DJIA and S&P 500 have both declined nine times.
(CLICK HERE FOR THE CHART!)
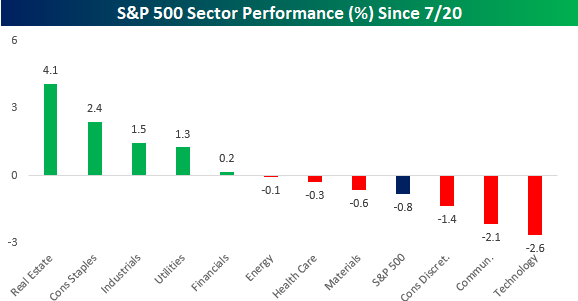
S&P 500 Stronger Underneath the Surface
Earlier today we posted a chart showing S&P 500 sector performance since the Nasdaq's recent peak on 7/20 when Technology stocks began what has now been a 10-day period of consolidation. Below we have updated these performance numbers to include today's moves. While not as many sectors remain in positive territory, the majority of sectors continue to outperform the S&P 500, while Technology drags the market lower. Along with Technology, Communication Services, and Consumer Discretionary are the only other sectors that have lagged the S&P 500, and their performance has been dragged down by the mega-cap tech-like stocks of Alphabet (GOOGL), Facebook (FB), and Amazon (AMZN).
(CLICK HERE FOR THE CHART!)
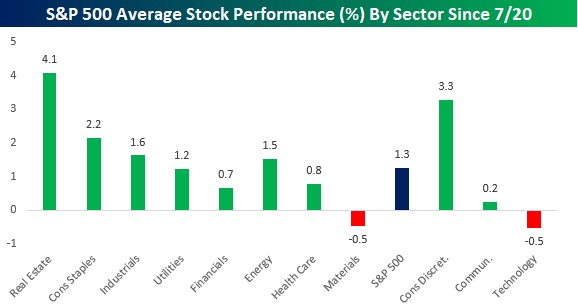
Expanding on this theme of underlying strength in the index, the chart below shows the average performance of stocks in the S&P 500 grouped by sector. On an equal-weighted basis, the S&P 500 is actually up 1.3% since 7/20, and only two sectors (Technology and Materials) have seen negative average returns. On the upside, Real Estate (4.1%) has been the big winner followed by Consumer Discretionary (3.3%), and Consumer Staples (2.2%). The fact that Consumer Discretionary at the cap-weighted sector level is down over 1.4% while the average performance of stocks in the sector has been a gain of 3.3% illustrates what a mammoth impact AMZN has on that sector.
(CLICK HERE FOR THE CHART!)
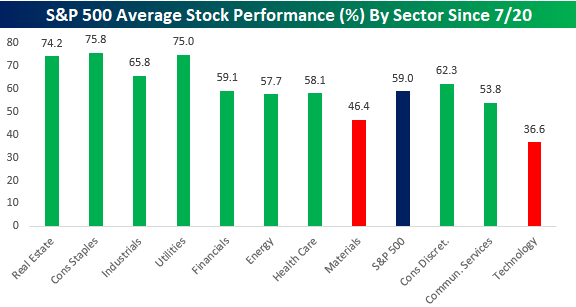
Breadth among S&P 500 stocks has also been overwhelmingly positive. For the S&P 500 as a whole, 59% of stocks in the index have had positive returns since the close on 7/20. Only two sectors (Technology and Materials) have seen fewer than half of their components post positive returns over that time, while Real Estate, Consumer Staples, and Utilities have seen roughly three-quarters of their components rally since 7/20.
(CLICK HERE FOR THE CHART!)
Bullish Earnings Season So Far
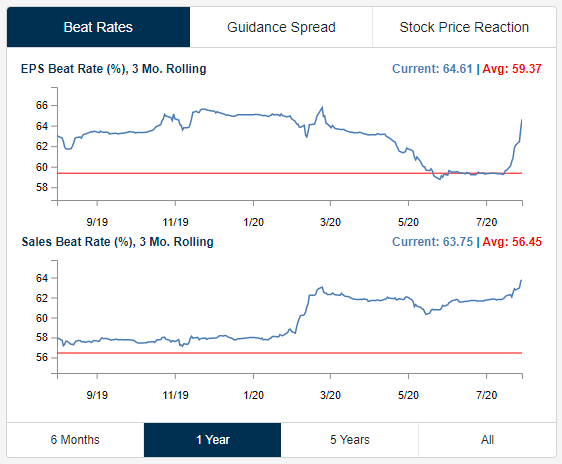
At our Earnings Explorer tool available to clients on our website, we provide a real-time look at beat rates for both EPS and sales. Below is a snapshot from the website showing both the EPS and sales beat rates for US companies reporting earnings on a rolling 3-month basis. Currently, 64.61% of companies have exceeded consensus analyst EPS estimates over the last three months, while 63.75% of companies have beaten consensus sales estimates over the same time frame.
In looking at the chart, you can see a big spike in the EPS beat rate over the last few weeks. Since earnings season began on July 13th, nearly 80% of companies have posted stronger than expected EPS numbers. That's a huge beat rate and suggests that analysts were too bearish on Q2 numbers heading into July. The revenue beat rate held up much better than EPS beats throughout the first half of 2020, but it too is on the upswing this season.
(CLICK HERE FOR THE CHART!)
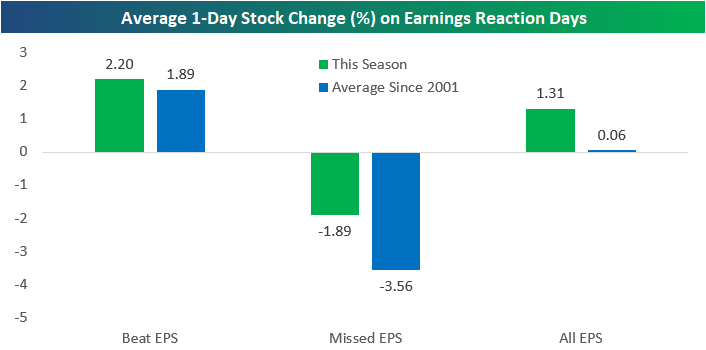
We also monitor how share prices are reacting to earnings reports. So far this earnings season, the average stock that has reported Q2 numbers has gained 1.31% on its earnings reaction day. That compares to a historical average one-day change of just 0.06% on earnings reaction days. As shown below, stocks that have beaten EPS estimates this season have gained 2.2% on earnings reaction days, while companies that have missed EPS estimates have fallen 1.89%. It's rare to see beats gaining more than misses decline, but that's what is happening this season.
(CLICK HERE FOR THE CHART!)
China Running Away YTD
Every Wednesday, we publish our Global Macro Dashboard which provides a high-level summary of market and economic data of some of the world's largest economies. Of the 23 stock markets tracked, just six including the US are positive year to date at the moment (in local currency). In the chart below we show the YTD performance of these six countries as well as the global median in 2020. As shown, even though it was actually the first to tip into the green YTD following the global sell-off in February and March very briefly back in early June, the US is up the least of this group with a YTD gain of 0.4%. China's stock market is up the most at +14%. Taiwan, South Korea, South Africa, and Malaysia are also outperforming the US but are up more modestly than China with the best of these, Taiwan, gaining 4.53% this year. Meanwhile, the median country in our Global Macro Dashboard remains down 6.2% YTD.
(CLICK HERE FOR THE CHART!)
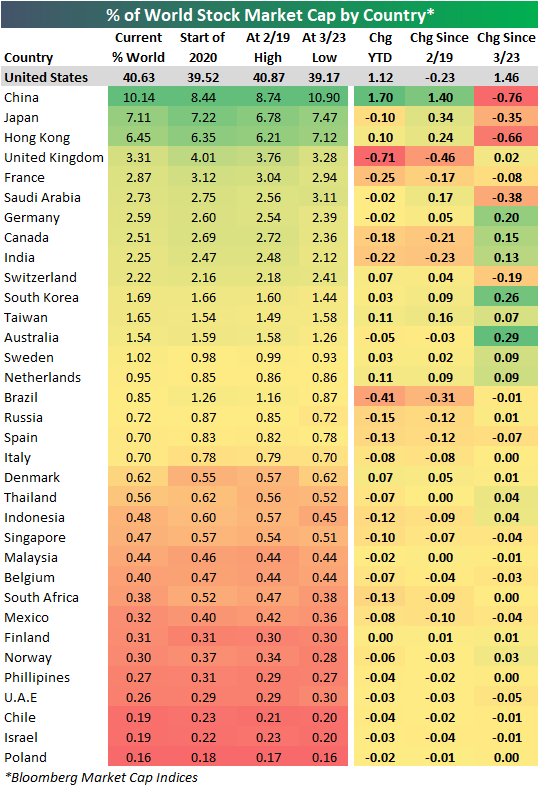
Given it is up the most on a year to date basis, China has also gained the largest share of global equity market cap in 2020. As shown in the table below, China has gained 1.7 percentage points of global market cap in 2020 and now takes up 10.14%. China now joins the US as the only other country with a double-digit share of total world market cap. Despite this, China has actually lost share since the bear market lows on 3/23. Meanwhile, the US, Germany, Canada, India, South Korea, and Australia have all gained a significant share since 3/23.
(CLICK HERE FOR THE CHART!)
Do the Top 5 Stocks Pose a Risk to the Market?
Apple, Microsoft, Amazon, Google, and Facebook. These five stocks have helped spawn a number of acronyms as they try to capture the rise of mega-cap tech stocks that have led the market higher for much of the past decade. The average return for those five stocks so far this year has been a gain of more than 30%, while the broad S&P 500 Index is just marginally positive, at 0.4% through July 30.
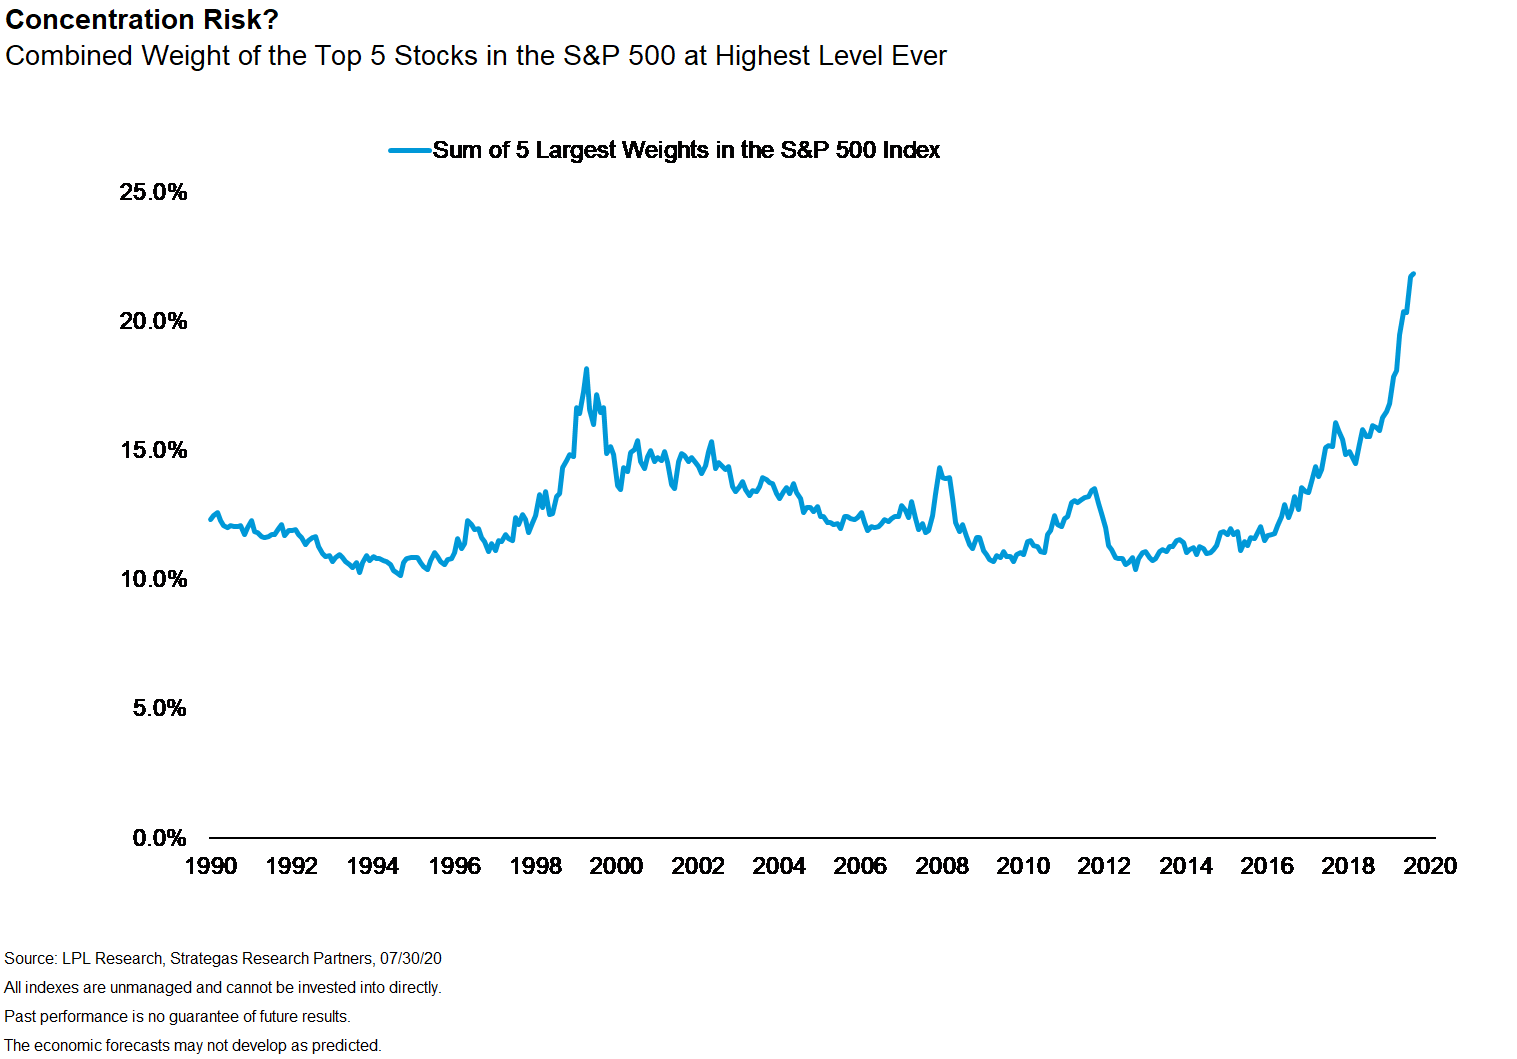
While many other areas of the market have remained largely static, the total market value of these stocks has dramatically increased, making them an increasingly large piece of market cap-weighted indexes such as the S&P 500. As shown in the LPL Chart of the Day, the combined weight of the top five stocks in the S&P 500 has increased to its highest level ever, at nearly 22%. Only one of those five stocks (Microsoft) was a top five name in the index during the previous peak of March 2000.
(CLICK HERE FOR THE CHART!)
But does this pose a risk to the index? From a diversification standpoint, one could certainly argue it does. For instance, if any shared risks should come up, from regulation, for example, it could do outsized damage to cap-weighted indexes. However, we believe that the recent gains have been justified by the fundamentals, and we continue to favor both large caps over small caps, and growth-style stocks over value stocks. According to analysis from Credit Suisse, over the past 12 months, the top five stocks in the index have grown revenues at 11.2% vs. just 0.8% for the rest of the S&P 500. Further, the remainder of the S&P 500 has subtracted roughly $17 from S&P 500 earnings per share (EPS), while the top five stocks have added more than $12.
Finally, while these stocks have been the face of the recent “stay-at-home trend” and may be more insulated from broader economic weakness, they are far from the only stocks making money this year. On July 30, the Philadelphia Stock Exchange Semiconductor Index hit a new all-time high and is now up more than 15% year-to-date.
“After a huge run, many of these top stocks may be due for a pause,” said LPL Chief Market Strategist Ryan Detrick. “However, looking out over the next 6 to 12 months, we believe that investors will continue to place a premium on companies that are able to organically grow sales, especially in a low-growth environment.”
Here are the most notable companies (tickers) reporting earnings in this upcoming trading week ahead-
- $CLX
- $BYND
- $SQ
- $MRNA
- $ROKU
- $FSLY
- $TSN
- $ATVI
- $CHGG
- $CVS
- $W
- $DIS
- $MELI
- $GPN
- $SPCE
- $TWLO
- $CMS
- $LVGO
- $MCK
- $AMRN
- $ETSY
- $PLUG
- $NET
- $BMY
- $RACE
- $TTWO
- $MPC
- $MPLX
- $ZNGA
- $DBX
- $DDOG
- $UBER
- $WIX
- $KOS
- $TTD
- $ENPH
- $CRON
- $BP
- $TEVA
- $PENN
- $FVRR
- $RNG
(CLICK HERE FOR NEXT WEEK'S MOST NOTABLE EARNINGS RELEASES!)
(CLICK HERE FOR NEXT WEEK'S HIGHEST VOLATILITY EARNINGS RELEASES!)
(CLICK HERE FOR NEXT WEEK'S HIGHEST INCREASE IN EARNINGS EXPECTATIONS!)
(CLICK HERE FOR MOST NOTABLE EARNINGS RELEASES FOR MONDAY, AUGUST 3RD, 2020!)
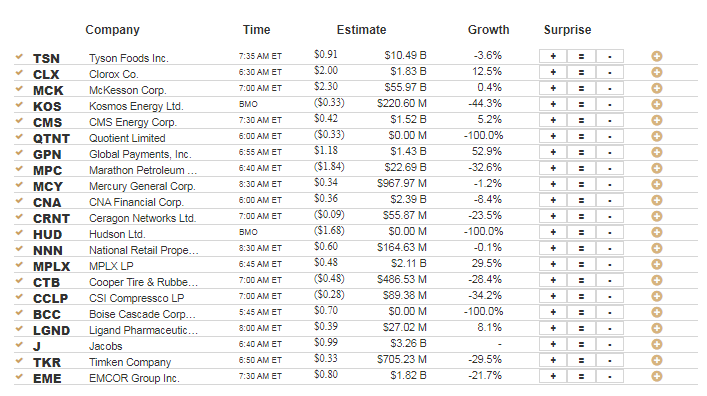
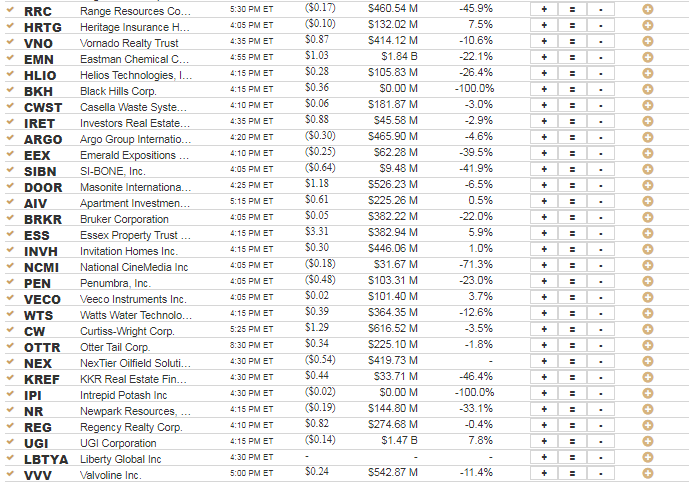
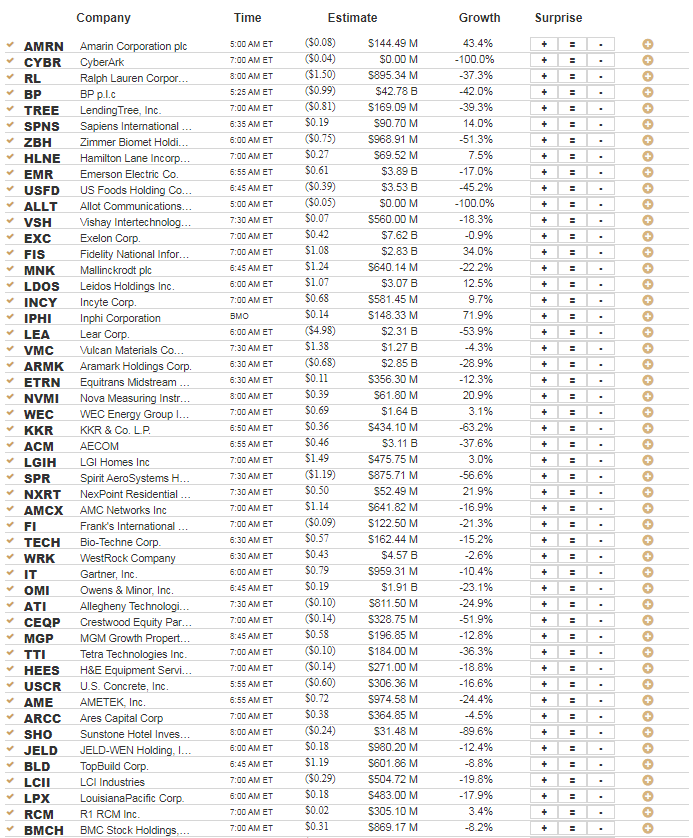
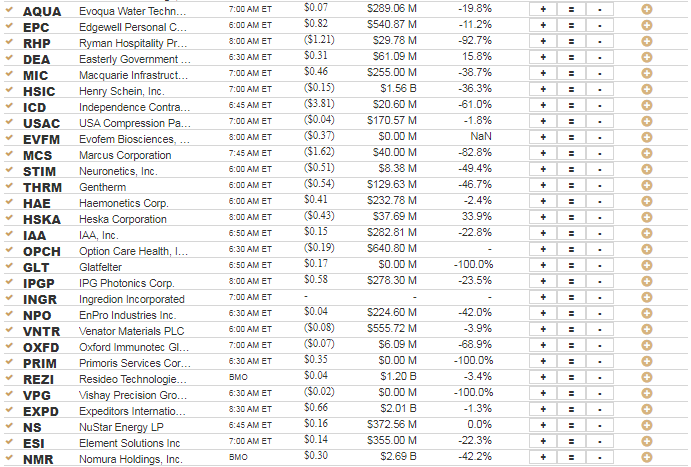
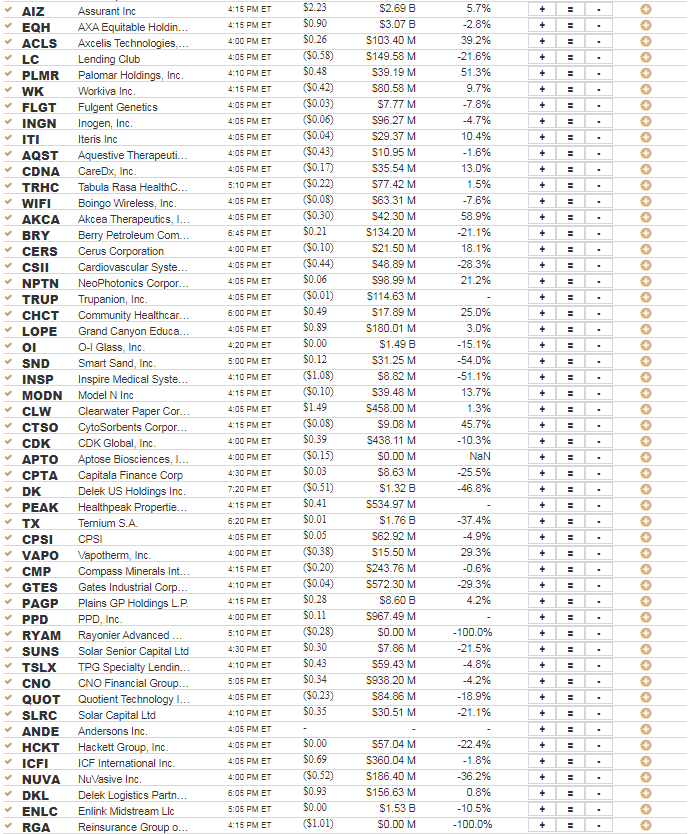
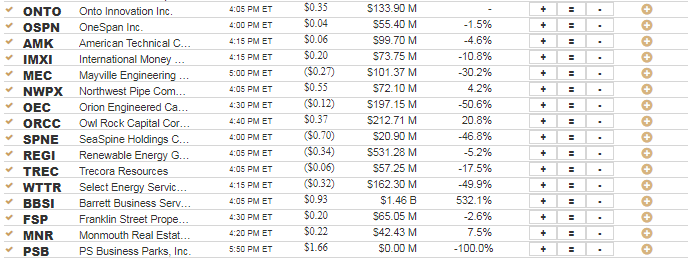
Below are some of the notable companies coming out with earnings releases this upcoming trading week ahead which includes the date/time of release & consensus estimates courtesy of Earnings Whispers:
Monday 8.3.20 Before Market Open:
(CLICK HERE FOR MONDAY'S PRE-MARKET EARNINGS TIME & ESTIMATES!)
Monday 8.3.20 After Market Close:
(CLICK HERE FOR MONDAY'S AFTER-MARKET EARNINGS TIME & ESTIMATES LINK #1!)
(CLICK HERE FOR MONDAY'S AFTER-MARKET EARNINGS TIME & ESTIMATES LINK #2!)
Tuesday 8.4.20 Before Market Open:
(CLICK HERE FOR TUESDAY'S PRE-MARKET EARNINGS TIME & ESTIMATES LINK #1!)
(CLICK HERE FOR TUESDAY'S PRE-MARKET EARNINGS TIME & ESTIMATES LINK #2!)
Tuesday 8.4.20 After Market Close:
(CLICK HERE FOR TUESDAY'S AFTER-MARKET EARNINGS TIME & ESTIMATES LINK #1!)
(CLICK HERE FOR TUESDAY'S AFTER-MARKET EARNINGS TIME & ESTIMATES LINK #2!)
(CLICK HERE FOR TUESDAY'S AFTER-MARKET EARNINGS TIME & ESTIMATES LINK #3!)
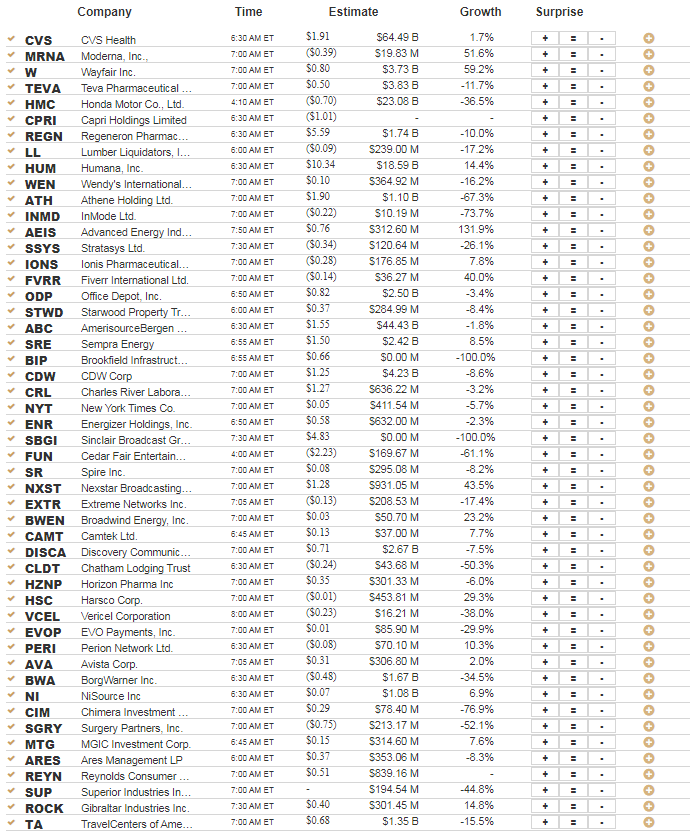
Wednesday 8.5.20 Before Market Open:
(CLICK HERE FOR WEDNESDAY'S PRE-MARKET EARNINGS TIME & ESTIMATES LINK #1!)
(CLICK HERE FOR WEDNESDAY'S PRE-MARKET EARNINGS TIME & ESTIMATES LINK #2!)
Wednesday 8.5.20 After Market Close:
(CLICK HERE FOR WEDNESDAY'S AFTER-MARKET EARNINGS TIME & ESTIMATES LINK #1!)
(CLICK HERE FOR WEDNESDAY'S AFTER-MARKET EARNINGS TIME & ESTIMATES LINK #2!)
(CLICK HERE FOR WEDNESDAY'S AFTER-MARKET EARNINGS TIME & ESTIMATES LINK #3!)
(CLICK HERE FOR WEDNESDAY'S AFTER-MARKET EARNINGS TIME & ESTIMATES LINK #4!)
Thursday 8.6.20 Before Market Open:
(CLICK HERE FOR THURSDAY'S PRE-MARKET EARNINGS TIME & ESTIMATES LINK #1!)
(CLICK HERE FOR THURSDAY'S PRE-MARKET EARNINGS TIME & ESTIMATES LINK #2!)
(CLICK HERE FOR THURSDAY'S PRE-MARKET EARNINGS TIME & ESTIMATES LINK #3!)
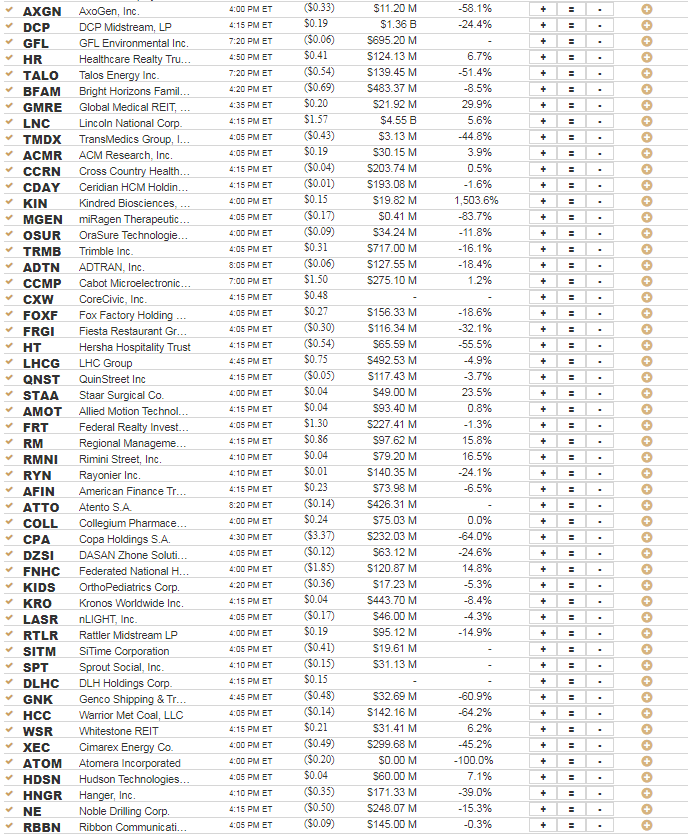
Thursday 8.6.20 After Market Close:
(CLICK HERE FOR THURSDAY'S AFTER-MARKET EARNINGS TIME & ESTIMATES LINK #1!)
(CLICK HERE FOR THURSDAY'S AFTER-MARKET EARNINGS TIME & ESTIMATES LINK #2!)
(CLICK HERE FOR THURSDAY'S AFTER-MARKET EARNINGS TIME & ESTIMATES LINK #3!)
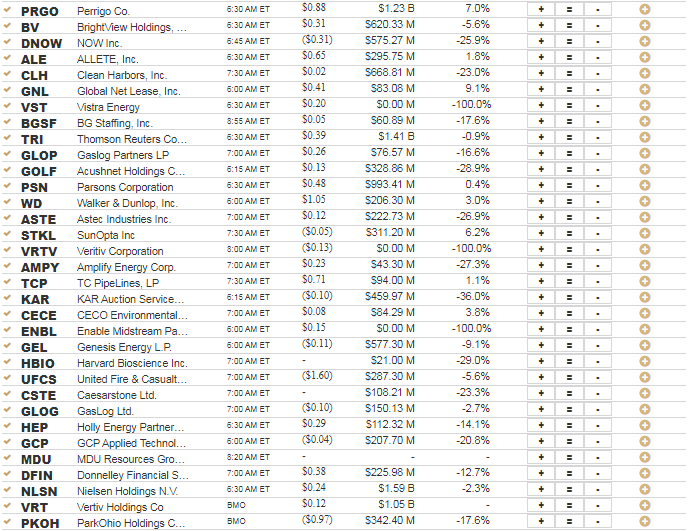
Friday 8.7.20 Before Market Open:
(CLICK HERE FOR FRIDAY'S PRE-MARKET EARNINGS TIME & ESTIMATES!)
Friday 8.7.20 After Market Close:
(CLICK HERE FOR FRIDAY'S AFTER-MARKET EARNINGS TIME & ESTIMATES!)
Clorox Co. $236.51
Clorox Co. (CLX) is confirmed to report earnings at approximately 6:30 AM ET on Monday, August 3, 2020. The consensus earnings estimate is $2.00 per share on revenue of $1.83 billion and the Earnings Whisper ® number is $2.06 per share. Investor sentiment going into the company's earnings release has 78% expecting an earnings beat. Consensus estimates are for year-over-year earnings growth of 6.38% with revenue increasing by 12.48%. Short interest has increased by 9.5% since the company's last earnings release while the stock has drifted higher by 22.5% from its open following the earnings release to be 33.0% above its 200 day moving average of $177.86. Overall earnings estimates have been revised higher since the company's last earnings release. On Friday, July 31, 2020 there was some notable buying of 2,147 contracts of the $250.00 call and 1,848 contracts of the $220.00 put expiring on Friday, August 7, 2020. Option traders are pricing in a 7.2% move on earnings and the stock has averaged a 4.6% move in recent quarters.
(CLICK HERE FOR THE CHART!)
Beyond Meat, Inc. $125.90
Beyond Meat, Inc. (BYND) is confirmed to report earnings at approximately 4:05 PM ET on Tuesday, August 4, 2020. The consensus estimate is for a loss of $0.02 per share on revenue of $97.75 million and the Earnings Whisper ® number is $0.01 per share. Investor sentiment going into the company's earnings release has 71% expecting an earnings beat. Consensus estimates are for earnings to decline year-over-year by 300.00% with revenue increasing by 45.35%. Short interest has decreased by 27.3% since the company's last earnings release while the stock has drifted higher by 14.2% from its open following the earnings release to be 21.7% above its 200 day moving average of $103.45. Overall earnings estimates have been revised lower since the company's last earnings release. The stock has averaged a 23.1% move on earnings in recent quarters.
(CLICK HERE FOR THE CHART!)
Square, Inc. $129.85
Square, Inc. (SQ) is confirmed to report earnings at approximately 4:05 PM ET on Wednesday, August 5, 2020. The consensus estimate is for a loss of $0.05 per share on revenue of $1.01 billion and the Earnings Whisper ® number is ($0.01) per share. Investor sentiment going into the company's earnings release has 59% expecting an earnings beat. Consensus estimates are for earnings to decline year-over-year by 126.32% with revenue decreasing by 13.99%. Short interest has decreased by 20.5% since the company's last earnings release while the stock has drifted higher by 85.9% from its open following the earnings release to be 71.3% above its 200 day moving average of $75.80. Overall earnings estimates have been revised higher since the company's last earnings release. On Tuesday, July 14, 2020 there was some notable buying of 9,381 contracts of the $97.50 call expiring on Friday, August 21, 2020. Option traders are pricing in a 9.7% move on earnings and the stock has averaged a 7.1% move in recent quarters.
(CLICK HERE FOR THE CHART!)
Moderna, Inc., $74.10
Moderna, Inc., (MRNA) is confirmed to report earnings at approximately 7:00 AM ET on Wednesday, August 5, 2020. The consensus estimate is for a loss of $0.36 per share on revenue of $19.83 million and the Earnings Whisper ® number is ($0.34) per share. Investor sentiment going into the company's earnings release has 66% expecting an earnings beat. Consensus estimates are for year-over-year earnings growth of 12.20% with revenue increasing by 51.57%. Short interest has increased by 3.5% since the company's last earnings release while the stock has drifted higher by 32.8% from its open following the earnings release to be 99.3% above its 200 day moving average of $37.17. Overall earnings estimates have been revised higher since the company's last earnings release. On Friday, July 24, 2020 there was some notable buying of 12,120 contracts of the $95.00 call expiring on Friday, August 21, 2020. Option traders are pricing in a 12.2% move on earnings and the stock has averaged a 8.3% move in recent quarters.
(CLICK HERE FOR THE CHART!)
Roku Inc $154.89
Roku Inc (ROKU) is confirmed to report earnings at approximately 4:00 PM ET on Wednesday, August 5, 2020. The consensus estimate is for a loss of $0.55 per share on revenue of $305.10 million and the Earnings Whisper ® number is ($0.47) per share. Investor sentiment going into the company's earnings release has 73% expecting an earnings beat. Consensus estimates are for earnings to decline year-over-year by 587.50% with revenue increasing by 21.99%. The stock has drifted higher by 23.3% from its open following the earnings release to be 23.0% above its 200 day moving average of $125.96. Overall earnings estimates have been revised lower since the company's last earnings release. On Monday, July 20, 2020 there was some notable buying of 4,243 contracts of the $125.00 put expiring on Friday, September 18, 2020. Option traders are pricing in a 13.8% move on earnings and the stock has averaged a 17.4% move in recent quarters.
(CLICK HERE FOR THE CHART!)
Fastly, Inc. $96.49
Fastly, Inc. (FSLY) is confirmed to report earnings at approximately 4:05 PM ET on Wednesday, August 5, 2020. The consensus estimate is for a loss of $0.01 per share on revenue of $60.42 million and the Earnings Whisper ® number is $0.01 per share. Investor sentiment going into the company's earnings release has 82% expecting an earnings beat The company's guidance was for revenue of $70.00 million to $72.00 million. Consensus estimates are for year-over-year earnings growth of 93.75% with revenue increasing by 30.86%. Short interest has increased by 186.2% since the company's last earnings release while the stock has drifted higher by 229.3% from its open following the earnings release to be 186.0% above its 200 day moving average of $33.74. Overall earnings estimates have been revised higher since the company's last earnings release. The stock has averaged a 17.8% move on earnings in recent quarters.
(CLICK HERE FOR THE CHART!)
Tyson Foods Inc. $61.45
Tyson Foods Inc. (TSN) is confirmed to report earnings at approximately 7:35 AM ET on Monday, August 3, 2020. The consensus earnings estimate is $0.90 per share on revenue of $10.49 billion and the Earnings Whisper ® number is $0.96 per share. Investor sentiment going into the company's earnings release has 44% expecting an earnings beat. Consensus estimates are for earnings to decline year-over-year by 38.78% with revenue decreasing by 3.63%. Short interest has decreased by 38.0% since the company's last earnings release while the stock has drifted higher by 5.5% from its open following the earnings release to be 14.3% below its 200 day moving average of $71.73. Overall earnings estimates have been revised lower since the company's last earnings release. On Friday, July 31, 2020 there was some notable buying of 1,804 contracts of the $60.00 put expiring on Friday, October 16, 2020. Option traders are pricing in a 6.6% move on earnings and the stock has averaged a 4.9% move in recent quarters.
(CLICK HERE FOR THE CHART!)
Activision Blizzard, Inc. $82.63
Activision Blizzard, Inc. (ATVI) is confirmed to report earnings at approximately 4:05 PM ET on Tuesday, August 4, 2020. The consensus earnings estimate is $0.63 per share on revenue of $1.70 billion and the Earnings Whisper ® number is $0.73 per share. Investor sentiment going into the company's earnings release has 81% expecting an earnings beat The company's guidance was for earnings of approximately $0.64 per share. Consensus estimates are for year-over-year earnings growth of 57.50% with revenue increasing by 21.78%. Short interest has decreased by 32.3% since the company's last earnings release while the stock has drifted higher by 11.7% from its open following the earnings release to be 29.7% above its 200 day moving average of $63.71. Overall earnings estimates have been revised higher since the company's last earnings release. On Friday, July 31, 2020 there was some notable buying of 8,749 contracts of the $85.00 call expiring on Friday, August 21, 2020. Option traders are pricing in a 8.4% move on earnings and the stock has averaged a 3.9% move in recent quarters.
(CLICK HERE FOR THE CHART!)
Chegg Inc. $80.97
Chegg Inc. (CHGG) is confirmed to report earnings at approximately 4:05 PM ET on Monday, August 3, 2020. The consensus earnings estimate is $0.32 per share on revenue of $136.52 million and the Earnings Whisper ® number is $0.35 per share. Investor sentiment going into the company's earnings release has 85% expecting an earnings beat The company's guidance was for revenue of $135.00 million to $137.00 million. Consensus estimates are for year-over-year earnings growth of 100.00% with revenue increasing by 45.45%. Short interest has decreased by 21.9% since the company's last earnings release while the stock has drifted higher by 51.1% from its open following the earnings release to be 74.9% above its 200 day moving average of $46.28. Overall earnings estimates have been revised higher since the company's last earnings release. On Thursday, July 30, 2020 there was some notable buying of 2,335 contracts of the $90.00 call expiring on Friday, August 21, 2020. Option traders are pricing in a 13.5% move on earnings and the stock has averaged a 13.6% move in recent quarters.
(CLICK HERE FOR THE CHART!)
CVS Health $62.94
CVS Health (CVS) is confirmed to report earnings at approximately 6:30 AM ET on Wednesday, August 5, 2020. The consensus earnings estimate is $1.91 per share on revenue of $64.49 billion and the Earnings Whisper ® number is $1.96 per share. Investor sentiment going into the company's earnings release has 75% expecting an earnings beat. Consensus estimates are for year-over-year earnings growth of 1.06% with revenue increasing by 1.67%. Short interest has increased by 21.9% since the company's last earnings release while the stock has drifted lower by 0.8% from its open following the earnings release to be 5.7% below its 200 day moving average of $66.72. Overall earnings estimates have been revised lower since the company's last earnings release. On Tuesday, July 28, 2020 there was some notable buying of 4,028 contracts of the $85.00 call expiring on Friday, September 18, 2020. Option traders are pricing in a 5.3% move on earnings and the stock has averaged a 4.6% move in recent quarters.
(CLICK HERE FOR THE CHART!)
DISCUSS!
What are you all watching for in this upcoming trading week?
I hope you all have a wonderful weekend and a great trading week ahead r/stocks.
submitted by /u/bigbear0083
[comments]
Source link
Higher gold follows risk like one foot follows the other. But this year has seen gold stocks generate a momentum that exceeds the usual rush to safe havens characteristic of a frothy market. In fact, some gold stocks have come to resemble cannabis tickers at the height of pot stock fever.
And that risk looks set to continue mounting — albeit in a dangerous, quiet kind of way. The markets are yet to factor in the disruption potential from the U.S. election. And with the race for a workable vaccine heating up after Russia’s Sputnik V news, volatility is sure to be an issue in coming months.
Despite this strong, sustained positive momentum, exemplary miner Newmont (TSX:NGT)(NYSE:NEM) still exhibits decent valuation relative to its sector. From a P/E of 12.7 to a P/B of 2.3, Newmont is still a good play for value in 2020.
Newmont’s dividend percentage yield may not be all that impressive compared with some of the rich-yielding heavy hitters on the TSX. But Newmont’s approximately 1.5% dividend is nevertheless worth the investment money. While that yield is small, it’s larger than those of many of its closest competitors.
Buying stocks for the super long term?
One thing that investors may want to keep an eye on is a company’s balance sheet. This is especially true if stocks are being bought for the long term. Newmont looks solid in this regard. Its debt-to-equity ratio is suitably low at 26.3%. This makes Newmont a strong choice for investors with a lower tolerance for risk in their stock portfolios. This is also a good name to hold for moderate growth.
The outlook for gold is solid with some analysts calling for the yellow metal to hit US$3,000. Having broken all kinds of records already in 2020, this kind of valuation might not be as ludicrous as it sounds. After all, investors are dealing with a bizarro market combining both the remnants of the longest bull run in history plus echoes of the Great Depression. This also makes gold stocks a buy for investors with narrow financial horizons.
In terms of track record and returns, Newmont will have bagged you around 80% in the past year compared with the metals sector’s average of 50%. Neither are bad returns by any means, but Newmont is clearly outperforming its own sector when it comes to rewarding investors. Looking forward, the outlook for Newmont is likely to see this trend in returns continuing into next summer.
Barrick Gold, Franco-Nevada, Kinross Gold, Kirkland Lake Gold — these stocks are all solid gold buys this year. But Newmont is arguably the best in terms of its all-around buying points. For its mix of decent scores in valuation, outlook, track record, dividend, and track record, Newmont is a strong buy. For investors with a focus on regular passive income, its 1.5% yield is a standout feature worthy of a place in a low-risk stock portfolio.
Gold is galloping, but good value for money can still be found. However, these FIVE stocks also match affordability with growth potential:
Just Released! 5 Stocks Under $49 (FREE REPORT)
Motley Fool Canada‘s market-beating team has just released a brand-new FREE report revealing 5 “dirt cheap” stocks that you can buy today for under $49 a share.
Our team thinks these 5 stocks are critically undervalued, but more importantly, could potentially make Canadian investors who act quickly a fortune.
Don’t miss out! Simply click the link below to grab your free copy and discover all 5 of these stocks now.
More reading
- How to Make Money Online With Stocks
- Investing in TSX Gold Stocks? Do This 1 Crucial Thing 1st
- Forget Bitcoin As a Gold Replacement in a Market Crash!
Fool contributor Victoria Hetherington has no position in any of the stocks mentioned.
The post Is This the Best Gold Stock to Buy in August? appeared first on The Motley Fool Canada.
5,045,564.
That's how many cases the US officially has (not that we are counting). 162,938 Americans are dead, that's much harder to cover up. Globally we are about to cross 20M cases at 19,877,261 with 731,570 deaths so the US has more than 25% of the global cases and 22% of the deaths - despite having just 3.7% of the population so Trump is right - America is leading the world by a factor of 6 - no one transmits the virus or dies from the virus like we do! MAGA!!!
The markets don't seem to mind and we're still up around record highs as the worst things are for the American people, the better things are for American Corporations, apparently, as the stimulus fairy comes and pays them visit after visit. President Trump played the fairy this weekend, waving his executive action wand and unconstitutionally wishing for various bribes to the voters:
- $400/week supplement to unemployment checks (states need to pay for it and Federal supplement comes from Disaster Fund that's meant for hurricanes, etc).
- Suspend payments on Student Loans through 12/31 (but not the interest).
- Extend eviction protection through 12/31 (the courts can't handle the backlog anyway)
- Defer Payroll Taxes through 12/31 (a disaster for the Social Security and Medicare System and also puts a huge tax burden on the employees at the end of the year they are unlikely to manage for, which will be blamed on Biden as a tax increase, of course)
In other words, Trump's Executive Orders are a whole lot of nothing but Congress and the White House have still failed to reconcile Democrats' $3.4Tn coronavirus-relief plan and Senate Republicans' far smaller $1.1Tn proposal. The Paycheck Protection Program expired Saturday. The future of the small business rescue plan is in limbo. “Meet us halfway and work together to deliver immediate relief to the American people,” Pelosi and Schumer said in a joint statement. “Lives are being lost, and time is of the essence.”
Joe Biden, noting that Trump signed the “half-baked” orders at his golf club in New Jersey, said they short-change the unemployed and trigger a “new, reckless war on Social Security." “These orders are not real solutions,” soon to be President Biden said. “They
…
- IPOX Indexes fall towards week-end, many still set weekly all-time Highs. Track SPACs with the IPOX® SPAC (SPAC).
- IPOX 100 U.S. (ETF: FPX) adds +0.80% to +12.64% YTD. IPOX International (ETF: FPXI) rises +2.31% to +40.58% YTD. IPOX 100 Europe (ETF: FPXE) gains +0.80% to +17.14% YTD.
- Issuer Flexibility matters: Rackspace (RXT) tanks while Rocket (RKT) rocks. More deals lined up.
Now track SPACs live with the IPOX® SPAC (Ticker: SPAC). IPOX is pleased to note the launch of the IPOX® SPAC, a benchmark portfolio focusing on Special Purpose Acquisition Vehicles.
IPOX Indexes fall towards week-end, many still set weekly all-time Highs. The IPOX Indexes rose last week to close at or near weekly-all-time highs. Trading Sentiment deteriorated towards the weekend on increased China-U.S. tensions with encouraging U.S. and European economic data driving some asset allocation away from the hugely outperforming growth-focused portfolios to conventional benchmark exposure and U.S. small-caps (RTY: +6.00%). In the U.S., e.g., the IPOX 100 U.S., underlying for the $1.5 billion “FPX” ETF, rose +0.80% to +12.64% YTD, lagging the S&P 500 (SPX) by -165 bps. on the week. Amid earnings and renewed corporate actions activity, weekly returns of portfolio holdings diverged sharply: While medical devices maker Irhytm Technologies (IRTC US: +62.33%) and security services provider ADT (ADT US: +41.70%) soared on strong earnings and an investment from Google, respectively, profit taking after earnings pressured infrastructure software makers Datadog (DDOG US: -19.80%) and Fastly (FSLY US: -17.70%). Abroad, we note a fresh weekly all-time
High recorded by number of IPOX Portfolios. The IPOX International, e.g., basis for the $220 million “FPXI” ETF, rose +2.31% to +40.58% YTD, extending the YTD lead vs. its benchmark to +4932 YTD. Here, big gains in Japan-traded exposure including leading courier services provider SG Holdings (9143 JP: +24.55%) and e-commerce firm Mercari (4385 JP: +16.97%) after blow-out earnings more than offset declines in some of the European-domiciled portfolio holdings including Swiss pharma products retailer Galenica (GALE SW: -6.99%) and German medical devices maker DAX-30 candidate Spin-off Siemens Healthineers (SHL GY: -6.07%) which fell after announcing the buy-out of U.S. medical equipment maker Varian (VAR US: +21.69%) last week-end.
| Select IPOX® Indexes Price Returns (%) | Last Week | 2019 | 2020 YTD |
| IPOX® Indexes: Global/International | |||
| IPOX® Global (IPGL50) (USD) | 1.63 | 27.93 | 32.47 |
| IPOX® International (IPXI)* (USD) (ETF: FPXI) | 2.31 | 31.37 | 40.58 |
| IPOX® Indexes: United States | |||
| IPOX® 100 U.S. (IPXO)* (USD) (ETF: FPX) | 0.80 | 29.60 | 12.64 |
| IPOX® ESG (IPXT) (USD) | 1.66 | - | - |
| IPOX® SPAC (SPAC) (USD) | 0.93 | - | - |
| IPOX® Indexes: Europe/Nordic | |||
| IPOX® 30 Europe (IXTE) (EUR) | 0.98 | 34.55 | 24.77 |
| IPOX® Nordic (IPND) | 3.70 | 38.52 | 37.05 |
| IPOX® 100 Europe (IPOE)* (USD) | 0.80 | 30.97 | 17.14 |
| IPOX® Indexes: Asia-Pacific/China | |||
| IPOX® Asia-Pacific (IPTA) (USD) | 4.12 | 4.41 | 23.31 |
| IPOX® China (CNI) (USD) | 3.44 | 26.31 | 44.31 |
| IPOX® Japan (IPJP)** (JPY) | 5.63 | 37.91 | 6.06 |
* Basis for ETFs: FPX US, FPX LN, FPXE US, FPXU FP, FPXI US, TCIP110 IT and CME-traded e-mini IPOX® 100 U.S. Futures (IPOM0). Source: Bloomberg L.P. & Refinitiv/Thomson Reuters. For IPOX Alternative Strategies Returns, please contact [email protected]
| IRHYTHM TECHNOLOGIES | 62.33 | DATADOG INC | -19.80 |
| ADT INC | 41.70 | FASTLY INC - CLASS A | -17.70 |
| SG HOLDINGS CO LTD | 24.55 | EVERGY INC | -14.92 |
| CARVANA CO | 23.91 | ASSETMARK FINANCIAL | -13.03 |
| SOLAREDGE | 20.77 | CAMPING WORLD | -11.61 |
| MERCARI INC | 16.97 | CORTEVA INC | -11.34 |
| SOLARWINDS CORP | 16.88 | BLACKLINE INC | -10.85 |
| INARI MEDICAL INC | 16.10 | TWILIO INC | -10.24 |
| VARTA AG | 15.91 | CROWDSTRIKE HOLDINGS | -10.11 |
| MEITUAN DIANPING | 15.89 | CERIDIAN HCM HOLDING | -10.07 |
| ASTON MARTIN LAGONDA | 15.46 | DYNATRACE INC | -9.54 |
Issuer Flexibility matters: Rackspace (RXT US) tanks while Rocket (RKT US) rocks. More deals lined up. At least 11 companies went public across the global regions last week, with the average (median) equally weighted deal adding +40.37% (+13.30%) based on the difference between the final offering price and respective Friday’s close. Reception to last week’s deals was mixed: While Apollo-backed cloud company Rackspace (RXT US: -26.67%) fell, Detroit mortgage giant Rocket Companies (RKT US: +38.33%) climbed strongly after its 1/3 scaled-back, below-range offer. Shopify (SHOP US: +2.92%) competitor BigCommerce (BIGC US: +229.17%) tripled. China’s largest CRO Tigermed (3347 HK: +13.30%) also debuted strongly in HK, marking the largest healthcare-related IPO in Asia YTD. Insurtech unicorn Duck Creek (DCT US), Tencent & SoftBank-backed Chinese real estate broker KE Holdings (BEKE US), PE-backed Brazilian home furnishing retailer Lojas Quero-Quero (LJQQ3 BZ) and Philippine’s first REIT IPO AyalaLand REIT (AREIT PM) are lined up to list this week. Other IPO news Include: 1) Chinese EV-maker XPeng to add on recent EV-maker IPO fest, 2) Lufthansa’s Technik maintenance unit spin-off IPO still on the table, and 3) KKR reported to revive IPO of defense supplier Hensoldt in Germany.
Track global deal flow live on: https://bit.ly/2WMvnT9
The post The IPOX® Week, August 10th, 2020 appeared first on Low Cost Stock & Options Trading | Advanced Online Stock Trading | Lightspeed |.

-
 Business3 weeks ago
Bernice King, Ava DuVernay reflect on the legacy of John Lewis
-
World News3 weeks ago
Heavy rain threatens flood-weary Japan, Korean Peninsula
-
 Technology2 weeks ago
Everything New On Netflix This Weekend: July 25, 2020
-
Finance3 months ago
Will Equal Weighted Index Funds Outperform Their Benchmark Indexes?
-
Marketing Strategies7 months ago
Top 20 Workers’ Compensation Law Blogs & Websites To Follow in 2020
-
 World News7 months ago
The West Blames the Wuhan Coronavirus on China’s Love of Eating Wild Animals. The Truth Is More Complex
-
Economy9 months ago
Newsletter: Jobs, Consumers and Wages
-
 Finance8 months ago
$95 Grocery Budget + Weekly Menu Plan for 8