Share Market
RRSP Investors: This Market Crash Is Your Chance to Retire Wealthy!
Over the past few weeks, Canadians have seen their RRSP balances decline thanks to a bear market that’s sending stocks into a death spiral. While no data on average RRSP losses is available, the TSX is down 37% since February 19.
Most likely, the average RRSP portfolio is down less than that, as most investors hold a mix of stocks, bonds and cash. However, it’s clear that most Canadian investors have seen the equity portion of their RRSPs decline recently.
That’s all the more reason to stay the course.
While it’s always scary to see your investments decline, bear markets are the best times to buy. With stocks cheaper than were a month ago, they’re set to soar the minute the coronavirus panic is over. Nobody knows when that will be, but the bull market that comes afterward will be unprecedented.
Stocks are getting cheaper than before
One undeniable fact about this crisis is that we’re seeing stocks get much cheaper than they were before. In terms of raw prices alone, Canadian stocks are down 37%. They’re also down relative to earnings.
If you look at Air Canada (TSX:AC)(TSX.AC.B) for example, it was trading at just 2.73 times earnings at market close Tuesday. That’s one of the lowest P/E ratios we’ve seen on a major TSX stock in a long time.
Of course, AC’s P/E relative to forward earnings is almost certainly higher. We’ve already seen enough flight cancellations this year to hit AC in the pocketbook-and who knows how much longer they’ll go on.
However, even if this year’s earnings are 50% lower than last year’s, we’ll have a P/E of just 5.5 based on today’s stock prices, which is still extremely cheap.
Not all stocks will be affected
Stocks like Air Canada will bounce back from this crisis sooner or later — that’s one piece of good news. An even better piece of news is that some stocks won’t likely be affected much in the first place.
While non-essential businesses are shutting down, essential businesses are still open, including grocery stores, pharmacies, railroads and real estate firms. Stocks in these industries could be good buys.
Fortis Inc (TSX:FTS)(NYSE:FTS) is a great example. Down 21% since March 6, it has fallen much less than the TSX. However, it’s still fallen enough to give it a super low 12.5 P/E ratio.
Fortis is one of those businesses that’s perfectly positioned to thrive in the current environment. As a utility, it’s unlikely to lose money as a result of the crisis. Heat and light are among the basic necessities of life, similar to groceries.
As a result, customers will keep paying for them even when times are tough. While many people are feeling the financial squeeze right now, enough government aid will be coming through to keep the lights on nationwide. The same is the case in other regions in which Fortis operates, such as the U.S. and the Caribbean.
In the 2008/2009 financial crisis, Fortis managed to increase its earnings for two years in a row. It was a testament to the power of utilities to drive shareholder value in tough economic times. It’s also a solid reason to consider holding FTS in your portfolio today.
5 TSX Stocks for Building Wealth After 50
BRAND NEW! For a limited time, The Motley Fool Canada is giving away an urgent new investment report outlining our 5 favourite stocks for investors over 50.
So if you’re looking to get your finances on track and you’re in or near retirement – we’ve got you covered!
You’re invited. Simply click the link below to discover all 5 shares we’re expressly recommending for INVESTORS 50 and OVER. To scoop up your FREE copy, simply click the link below right now. But you will want to hurry – this free report is available for a brief time only.
More reading
- Should You Buy Air Canada (TSX:AC) Stock Right Now?
- Stock Market Crash 2020: Air Canada (TSX:AC) Is Totally Grounded
- Buying Airline Stocks Now Will Pay off for Canadians Long Term
- Air Canada (TSX:AC): Now Is the Time to Buy!
- COVID-19 Crash: 2 Must-Buy Dividend Aristocrat Stocks
Fool contributor Andrew Button has no position in any of the stocks mentioned.
The post RRSP Investors: This Market Crash Is Your Chance to Retire Wealthy! appeared first on The Motley Fool Canada.
The pandemic market crash hammered most companies in recent months, but Air Canada (TSX:AC) and other airline stocks really took a beating.
Air Canada stock price crashes
Air Canada traded above $50 per share earlier this year. The milestone seemed set to expand, and analysts finally started warming up to the company after years of scepticism on the airline’s prospects.
Why?
Air Canada has a history of destroying investor wealth. The airline went into bankruptcy protection in 2003 as a result of the SARS outbreak. A restructuring allowed it to exit bankruptcy after difficult negotiations with staff and creditors.
The financial crisis nearly wiped out investors again in 2009. Air Canada traded near $20 in 2017. By early 2009, the stock traded below $1, and the situation remained uncertain through the middle of 2013. Even then, the stock sat just above the $2 mark.
The past seven years, however, saw the company’s revenue and profits soar. Airlines realized they could make a lot of extra money by charging for perks they historically provided for free. In addition, the drop in oil prices off the 2014 highs bolstered profits as fuel costs plunged.
Air Canada’s stock surge from below $1 to above $50 made it one of Canada’s best-performing stocks over the past seven years.
Pandemic outlook
The arrival of the COVID-19 pandemic rapidly changed the outlook for the company and its investors. As government travel restrictions increased across the globe, the prospects for Air Canada and its peers became increasingly worrisome.
The stock plunged from $45 on February 20 to $12 a month later. Since then, the share price traded as high as $23 in early June. At the time of writing, Air Canada trades close to $17.
COVID-19 continues to spread, and countries that quickly brought the virus under control are now experiencing a second wave, as they attempt to reopen their economies. South of the border, the United States continues to see cases climb.
The American market is important for Air Canada, and it is unclear when the Canadian government will allow visitors from the U.S., let alone other countries.
Can Air Canada survive?
Air Canada continues to press the government to ease restrictions. The company cut roughly 20,000 jobs in June and reported a Q2 2020 operating loss of $1.56 billion.
Passenger numbers fell 96% in the three months ended June 30 compared to last year. Total revenue dropped 89%, with a gain in cargo revenue being the only bright spot.
Cost-cutting efforts continue. Air Canada is now a much smaller business, and it will be interesting to see when the airline can halt the cash burn.
To their credit, management took advantage of opportunities in the market in recent months to raise substantial capital. Air Canada finished Q2 with more than $9 billion in liquidity, so it won’t run out of money in the near term.
However, there remains significant uncertainty as to whether restrictions will ease in a timely manner.
Travelers with COVID-19 continue to board flights. Some are Canadians returning from trips to other countries, and others are moving between provinces.
Each time a provincial public health agency sends out a warning about possible exposure on recent flights, the airlines risk an extended setback in seat bookings.
Should you buy Air Canada stock?
Air Canada won’t disappear, but history suggests investors should be cautious right now. At this point, the downside risks probably outweigh the upside potential over the near term.
Contrarian investors might be tempted to buy at this level, but I would search for other cheap stocks that at least offer a decent dividend while you wait for the recovery.
Just Released! 5 Stocks Under $49 (FREE REPORT)
Motley Fool Canada‘s market-beating team has just released a brand-new FREE report revealing 5 “dirt cheap” stocks that you can buy today for under $49 a share.
Our team thinks these 5 stocks are critically undervalued, but more importantly, could potentially make Canadian investors who act quickly a fortune.
Don’t miss out! Simply click the link below to grab your free copy and discover all 5 of these stocks now.
More reading
- Air Canada (TSX:AC) Stock: A Shocking 89% Decline in Revenues
- How to Bet on Air Canada (TSX:AC) Stock
- 3 Reasons I’ll Never Sell Air Canada (TSX:AC) Stock
- Warren Buffett Screams: Don’t Buy the Stock Market!
- Air Canada (TSX:AC): Investor Patience May Be Rewarded Profoundly
Fool contributor Andrew Walker has no position in the companies mentioned.
The post Air Canada (TSX:AC) Stock: Can Air Canada Survive the Pandemic? appeared first on The Motley Fool Canada.
Good Saturday morning to all of you here on r/stocks. I hope everyone on this sub made out pretty nicely in the market this past week, and is ready for the new trading week ahead.
Here is everything you need to know to get you ready for the trading week beginning August 17th, 2020.
Stocks are ignoring the lack of a stimulus package from Congress, but that could change - (Source)
Stocks could hang at record levels but gains may be capped until Congress agrees to a new stimulus package to help the economy and the millions of unemployed Americans.
Stocks were higher in the past week, and the S&P 500 flirted with record levels it set in February.
In the coming week, there are some major retailers reporting earnings, including Walmart, Home Depot and Target, but the season is mostly over and the market is entering a quiet period. There are minutes from the Fed’s last meeting, released Wednesday, and housing data, including starts Tuesday and existing sales Friday.
Investors had been watching efforts by Congress to agree to a new stimulus package, but talks have failed and the Senate has gone on recess. There is a concern that Congress will not be convinced to provide a big enough package when it does get to work again on the next stimulus round because recent economic reports look stronger. July’s retail sales, for example, climbed to a record level and recovered to pre-pandemic levels.
“The juxtaposition of getting more fiscal stimulus and better data has paralyzed us in our tracks … we’ve seen this sideways [market] action,” said Art Hogan, chief market strategist at National Alliance. “It feels like we need more action from Congress, and the concern is the longer we wait, the better the data gets and the less impactful the next round of stimulus will be.”
Some technical analysts say the market may pull back around the high, to allow it to consolidate gains before moving higher into the end of the year. The S&P 500 reached an all-time high of 3,393 on Feb. 19.
Hogan said he expects stocks to tread sideways during the dog days of August, but they could begin to react negatively to the election in September. He also said it is important that progress continue against the spread of Covid-19, as the economy continues to reopen.
Peter Boockvar, chief investment strategist at Bleakley Advisory Group, said the market could have a wakeup call at some point that the stimulus package has not been approved.
“I think it will cross over a line where they care,” he said. “I think the market is in suspended animation of believing there will be a magical deal.” Boockvar said he expects a deal ultimately, but the impact is not likely to be as big as the last round of funding.
“What they’re not grasping is any deal, any extension of unemployment benefits, is going to be smaller than it was, and the rate of change should be the most important thing investors focus on,” he said. “Not the binary outcome of whether there’s a deal or no deal. There’s going to be less air going into the balloon.”
It’s the economy
Still, economists expect to see a strong rebound in the third quarter, and are anticipating about about a 20% jump in third-quarter growth. But they also say that could be threatened if Congress does not help with another stimulus package.
Mark Zandi, chief economist at Moody’s Analytics, described the July retail sales as a perfect V-shaped recovery, but cautioned it would not last unless more aid gets to individuals and cities and states. Democrats have sought a $3 trillion spending package, and Republicans in the Senate offered a $1 trillion package. They could not reach a compromise, including on a $600 weekly payment to individuals on unemployment which expired July 31.
President Donald Trump has tried to fill the gap with executive orders to provide extra benefits to those on unemployment, but the $300 federal payment and $100 from states may take some time to reach individuals, as the processing varies by state. He has also issued an order instructing the Treasury to temporarily defer collection of payroll taxes from individuals making up to $104,000.
“I think in August and September, there will be a lot of Ws, if there’s not more help here,” said Zandi, referring to an economic recovery that retrenches from a V shape before heading higher again. “It’s clearly perplexing. It may take the stock market to say we’re not going to get what we expect, and sell off and light a fire.”
Zandi said it could come to a situation like 2008, where the stock market sold off sharply before Congress would agree to a program that helped financial companies.
“We need a TARP moment to get these guys to help. Maybe if the claims tick higher and the August employment numbers are soft, given the president is focused on the stock market, that might be what it takes to get them back to the table in earnest,” he said, referring to the Troubled Asset Relief Program that helped rescue banks during the financial crisis.
He ultimately expects a package of about $1.5 trillion to be approved in September.
The lack of funding for state and local governments could result in more layoffs, as they struggle with their current 2021 budgets, Zandi said. Already 1.3 million public sector jobs have been lost since February, and there will be more layoffs and more programs and projects cancelled. The impact will hit contractors and other businesses that provide services to local governments.
“The multipliers on state and local government are among the highest of any form of support, so if you don’t provide it, it’s going to ripple through the economy pretty fast,” he said.
Economists expect to see a softening in consumer spending in August with the more than 28 million Americans on unemployment benefits as of mid-July no longer receiving any supplemental pay.
“The real irony is things are shaping up that September is going to be a bad month, and that’s going to show up in all the data in October,” Zandi said. “They are really taking a chance on this election by not acting.”
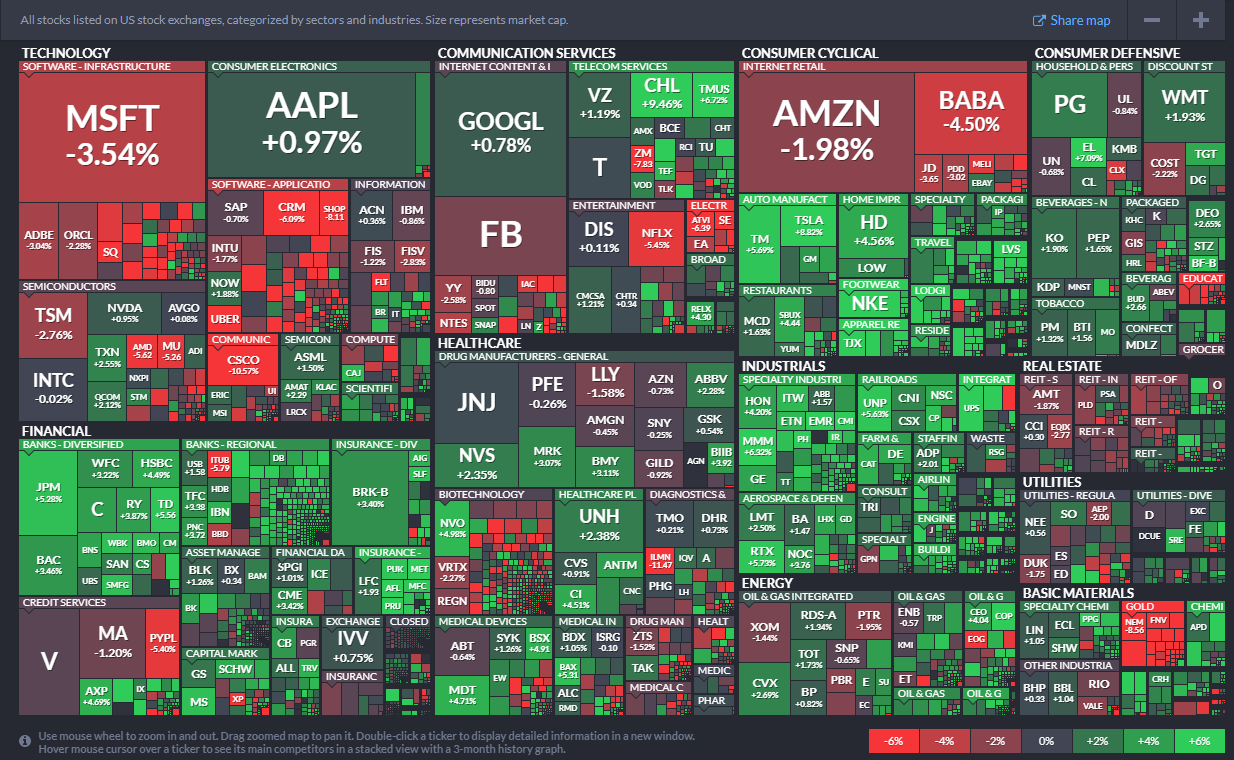
This past week saw the following moves in the S&P:
(CLICK HERE FOR THE FULL S&P TREE MAP FOR THE PAST WEEK!)
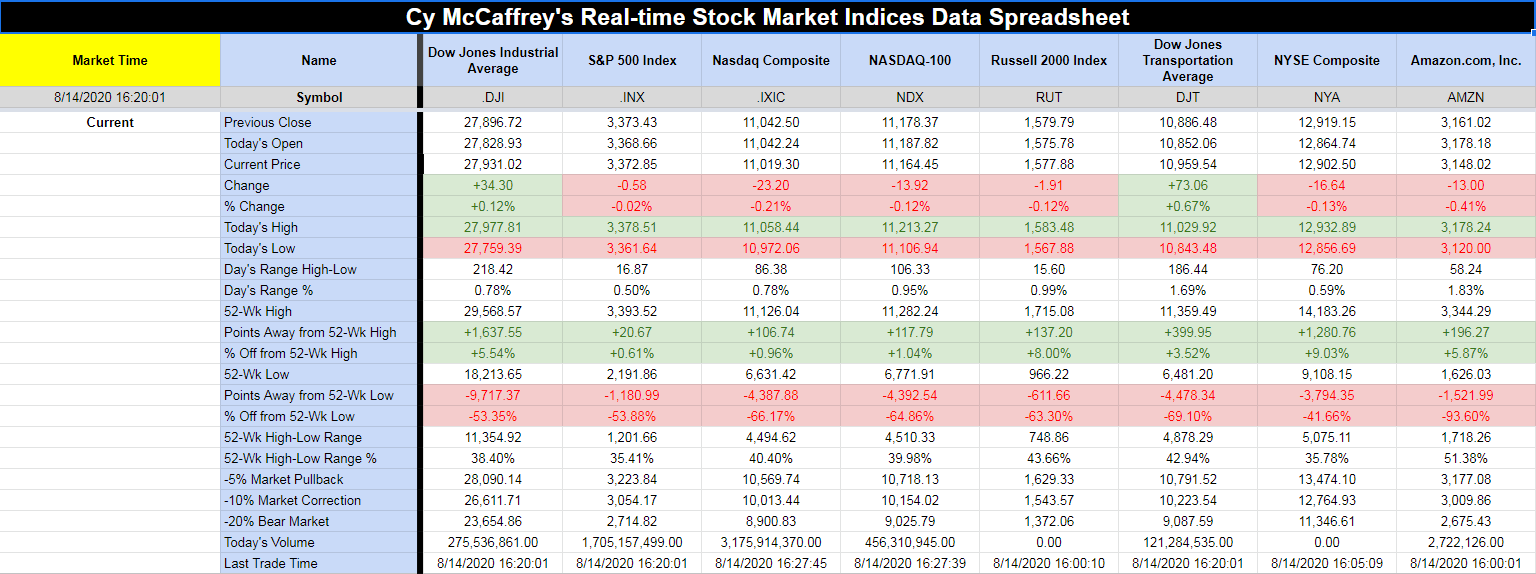
Major Indices for this past week:
(CLICK HERE FOR THE MAJOR INDICES FOR THE PAST WEEK!)
Major Futures Markets as of Friday's close:
(CLICK HERE FOR THE MAJOR FUTURES INDICES AS OF FRIDAY!)
Economic Calendar for the Week Ahead:
(CLICK HERE FOR THE FULL ECONOMIC CALENDAR FOR THE WEEK AHEAD!)
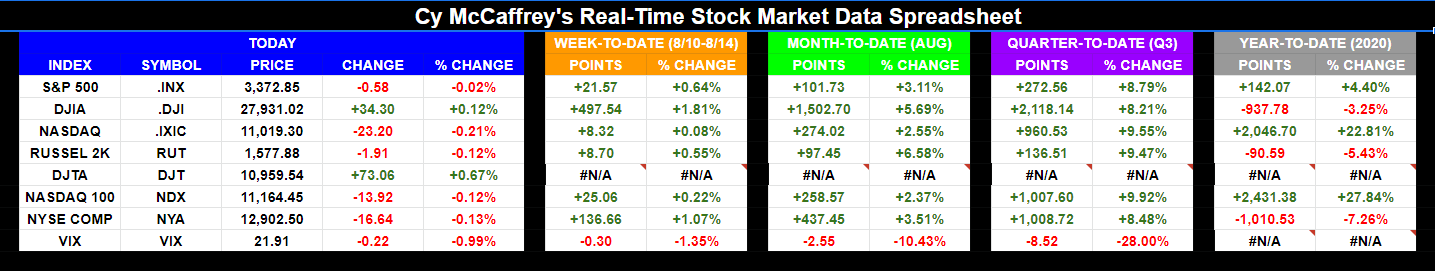
Percentage Changes for the Major Indices, WTD, MTD, QTD, YTD as of Friday's close:
(CLICK HERE FOR THE CHART!)
S&P Sectors for the Past Week:
(CLICK HERE FOR THE CHART!)
Major Indices Pullback/Correction Levels as of Friday's close:
(CLICK HERE FOR THE CHART!
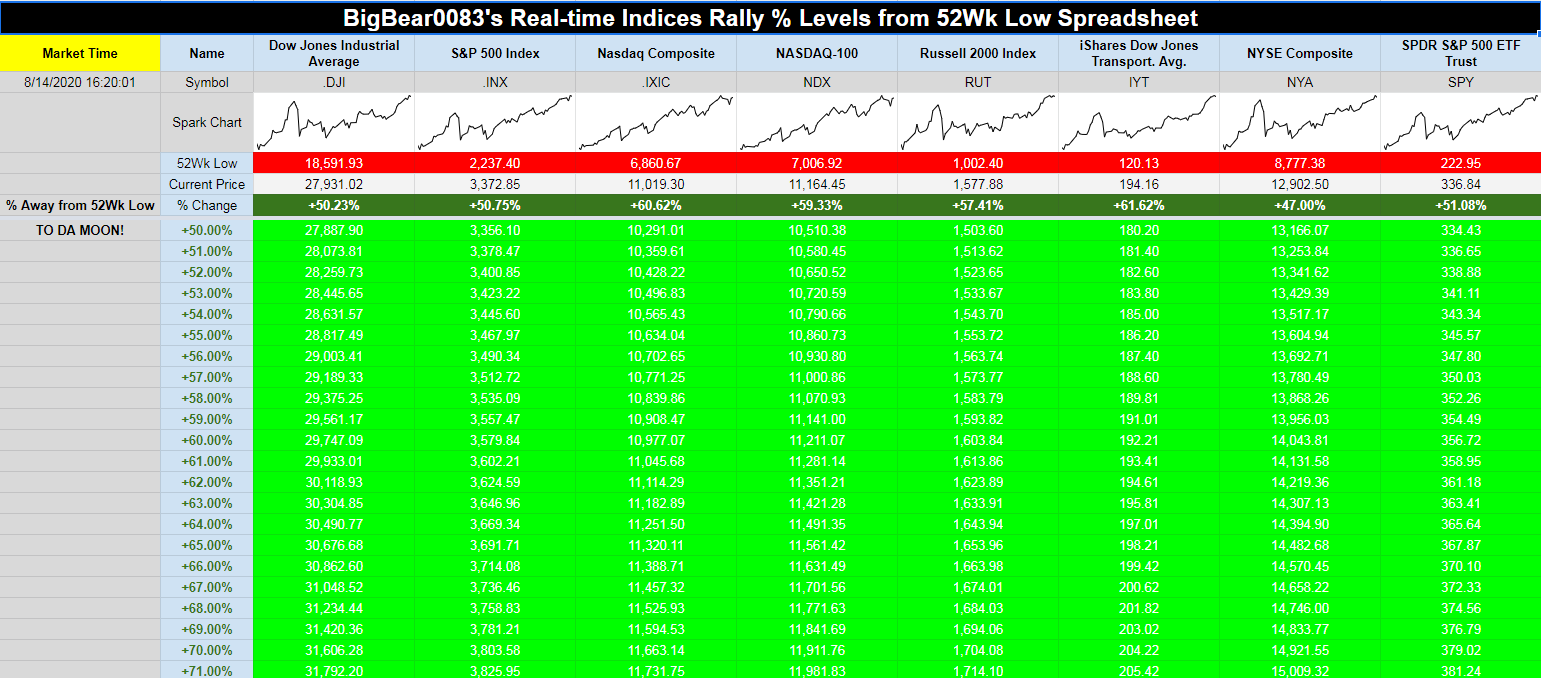
Major Indices Rally Levels as of Friday's close:
(CLICK HERE FOR THE CHART!)
Most Anticipated Earnings Releases for this week:
(CLICK HERE FOR THE CHART!)
Here are the upcoming IPO's for this week:
(CLICK HERE FOR THE CHART!)
Friday's Stock Analyst Upgrades & Downgrades:
(CLICK HERE FOR THE CHART LINK #1!)
(CLICK HERE FOR THE CHART LINK #2!)
4 Charts That Will Amaze You
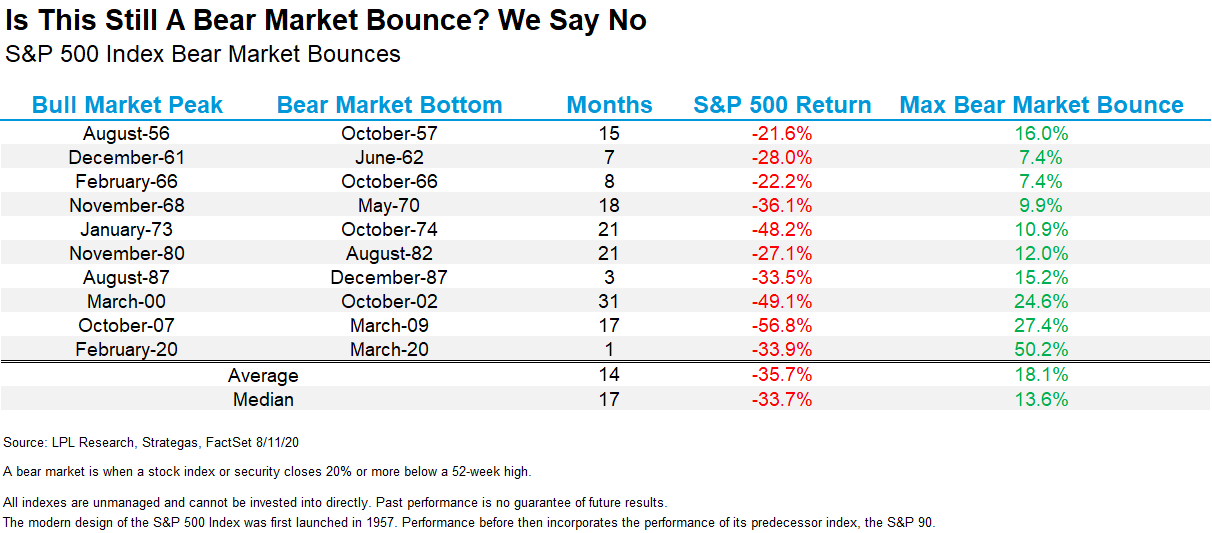
The S&P 500 Index is a few points away from a new all-time high, completing one of the fastest recoveries from a bear market ever. But this will also seal the deal on the shortest bear market ever. Remember, the S&P 500 Index lost 20% from an all-time high in only 16 trading days back in February and March, so it makes sense that this recovery could be one of the fastest ever.
From the lows on March 23, the S&P 500 has now added more than 50%. Many have been calling this a bear market rally for months, while we have been in the camp this is something more. It’s easy to see why this rally is different based on where it stands versus other bear market rallies:
(CLICK HERE FOR THE CHART!)
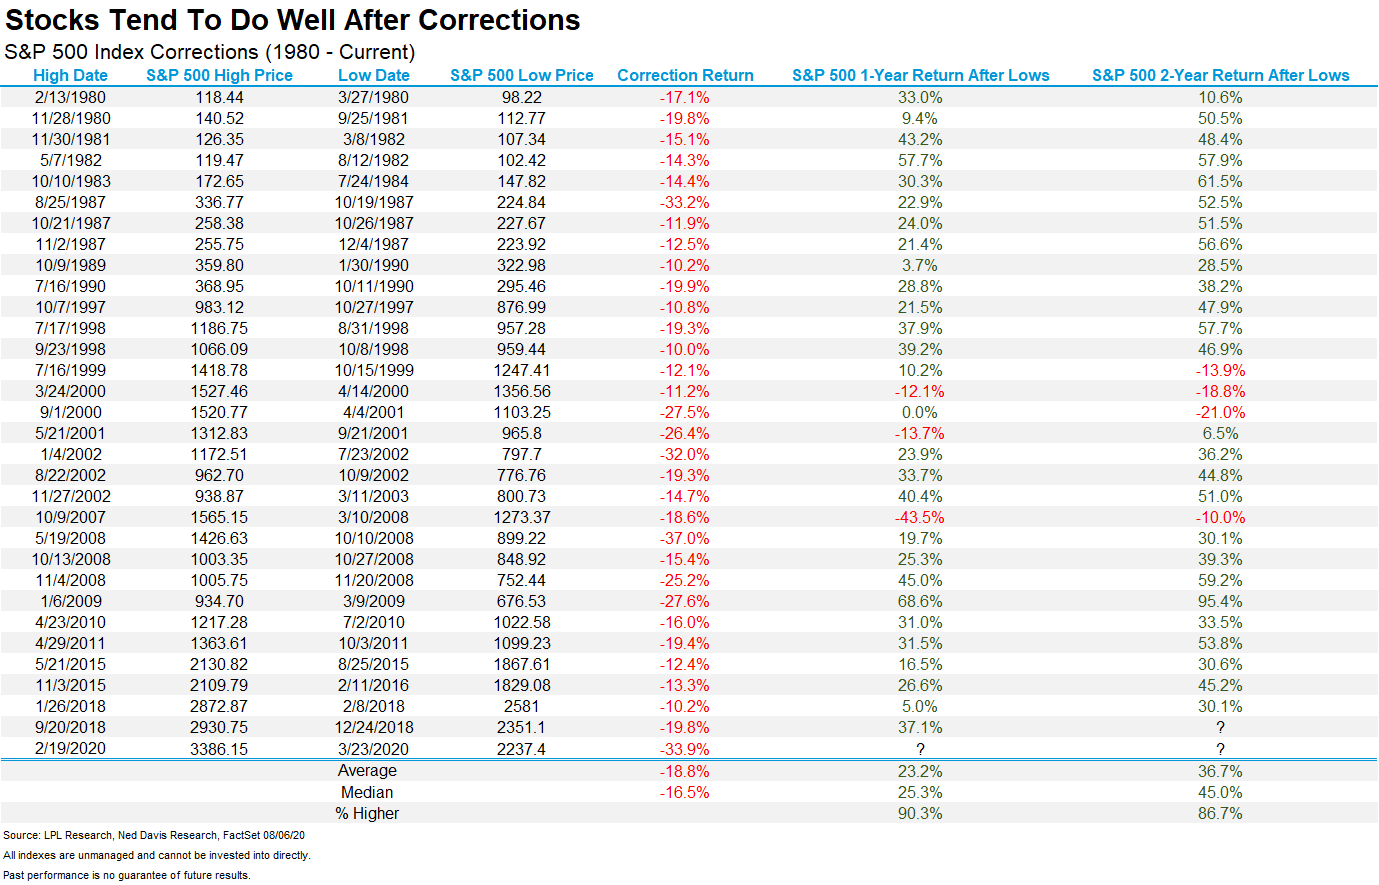
They say the stock market is the only place where things go on sale, yet everyone runs out of the store screaming. We absolutely saw that back in March and now with stocks near new highs, many have missed this record run. Here we show how stocks have been usually higher a year or two after corrections.
(CLICK HERE FOR THE CHART!)
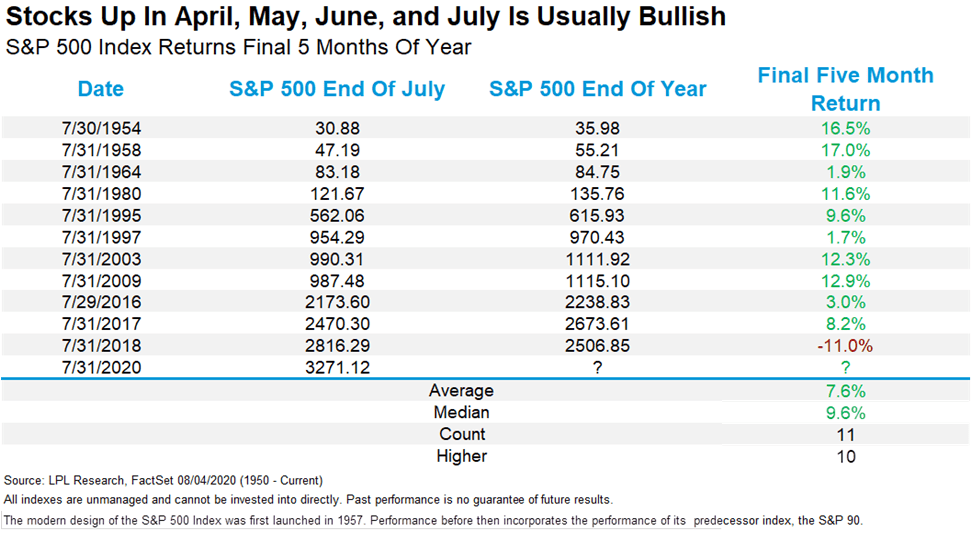
After a historic drop in March, the S&P 500 has closed higher in April, May, June, and July. This rare event has happened only 11 other times, with stocks gaining the final five months of the year a very impressive 10 times. Only 2018 and the nearly 20% collapse in December saw a loss those final five months.
(CLICK HERE FOR THE CHART!)
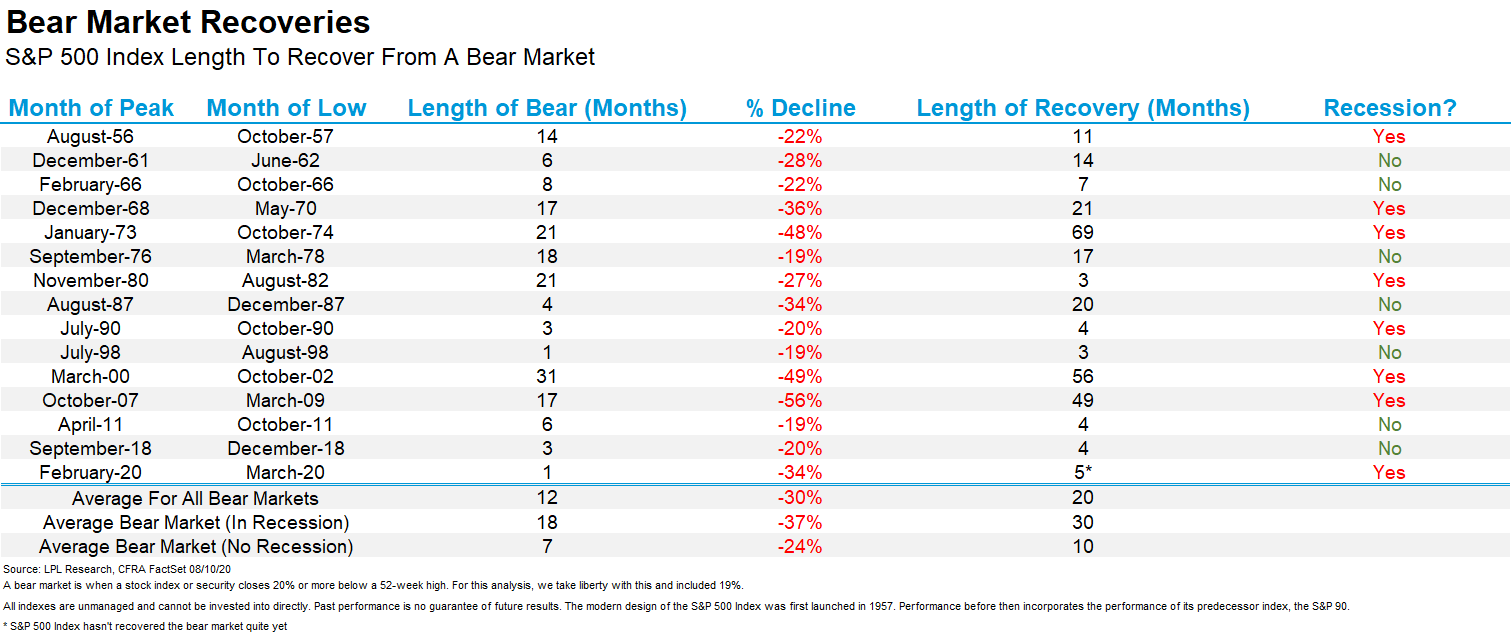
As shown in the LPL Chart of the Day, this bear market will go down as the fastest ever, at just over one month. The recovery back to new highs will be five months if we get there by August 23, making this one of the fastest recoveries ever. Not surprisingly, it usually takes longer for bear markets in a recession to recover; only adding to the impressiveness of this rally.
(CLICK HERE FOR THE CHART!)
“It normally takes 30 months for bear markets during a recession to recover their losses, which makes this recovery all the more amazing,” said LPL Financial Chief Market Strateigst Ryan Detrick.. “Then again, there has been nothing normal about this recession, so maybe we shouldn’t be shocked about yet another record going down in 2020.”
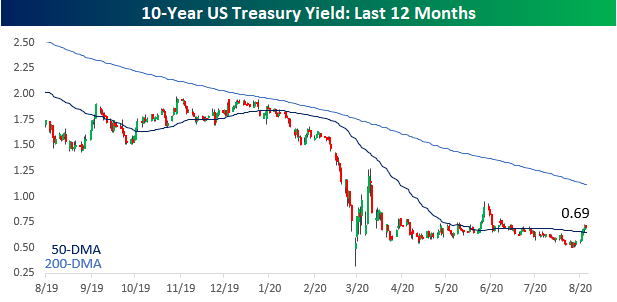
When a Few Basis Points Packs a Punch
US Treasury yields have been on the rise this week with the 10-year yield rising 13 basis points (bps) from 0.56% up to 0.69% after getting as high as 0.72% on Thursday. A 13 bps move higher in interest rates may not seem like a whole lot, but with rates already at such low levels, a small move can have a pretty big impact on the prices of longer-term maturities.
(CLICK HERE FOR THE CHART!)
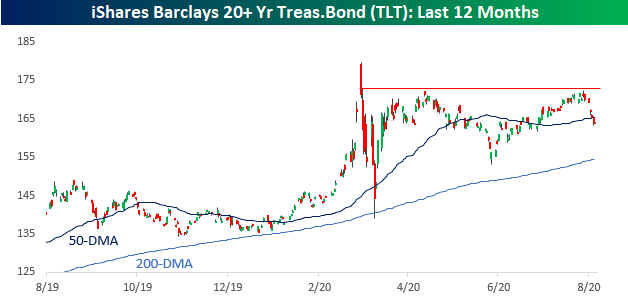
Starting with longer-term US Treasuries, TLT, which measures the performance of maturities greater than 20 years, has declined 3.5% this week. Now, for a growth stock, 3.5% is par for the course, but that kind of move in the Treasury market is no small thing. The latest pullback for TLT also coincides with another failed attempt by the ETF to trade and stay above $170 for more than a day.
(CLICK HERE FOR THE CHART!)
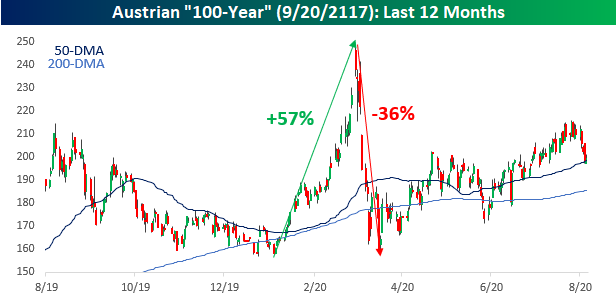
The further out the maturity window you go in the fixed income market, the bigger the impact of the move higher in interest rates. The Republic of Austria issued a 100-year bond in 2017, and its movements exemplify the wild moves that small changes in interest rates (from a low base) can have on prices. Just this week, the Austrian 100-year was down over 5%, which is a painful move no matter what type of asset class you are talking about. This week's move, though, was nothing compared to the stomach-churning swings from earlier this year. When Covid was first hitting the fan, the 100-year rallied 57% in the span of less than two months. That kind of move usually occurs over years rather than days, but in less than a third of that time, all those gains disintegrated in a two-and-a-half week span from early to late March. Easy come, easy go. Ironically enough, despite all the big up and down moves in this bond over the last year, as we type this, the bond's price is the same now as it was on this same day last year.
(CLICK HERE FOR THE CHART!)
Retail Sales Rock to New Highs
At the headline level, July’s Retail Sales report disappointed as the reading missed expectations by nearly a full percentage point. Just as soon as the report was released, we saw a number of stories pounce on the disappointment as a sign that the economy was losing steam. Looked at in more detail, though, the July report wasn’t all that bad. While the headline reading rose less than expected (1.2% vs 2.1%), Ex Autos and Ex Autos and Gas, the results were much better than expected. Not only that, but June’s original readings were all revised higher by around a full percentage point.
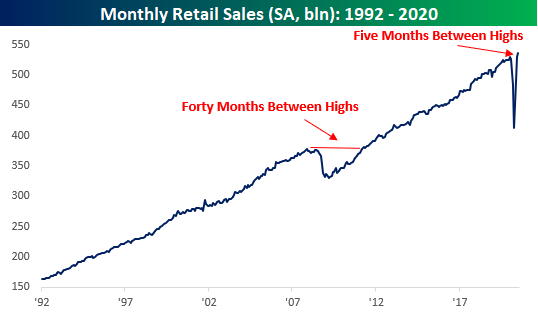
Besides the fact that this month’s report was better underneath the surface and June’s reading was revised higher, it was also notable as the seasonally-adjusted annualized rate of sales in July hit a new record high. After the last record high back in January, only five months passed until American consumers were back to their pre-Covid spending ways. For the sake of comparison, back during the Financial Crisis, 40 months passed between the original high in Retail Sales in November 2007 and the next record high in April 2011. 5 months versus 40? Never underestimate the power of the US consumer!
(CLICK HERE FOR THE CHART!)
While the monthly pace of retail sales is back at all-time highs, the characteristics behind the total level of sales have changed markedly in the post COVID world. In our just released B.I.G. Tips report we looked at these changing dynamics to highlight the groups that have been the biggest winners and losers from the shifts.
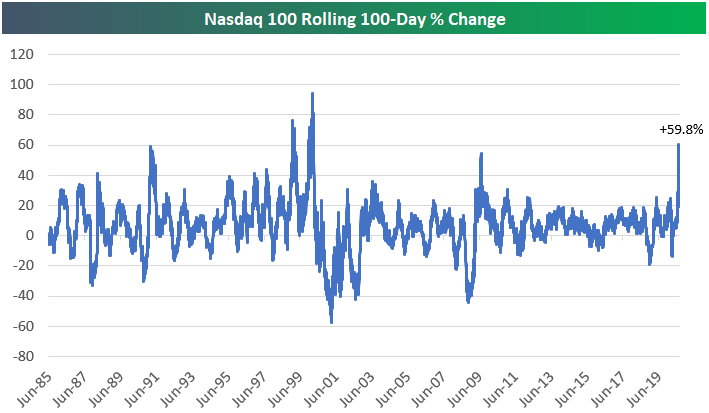
100 Days of Gains
Today marked 100 trading days since the Nasdaq 100's March 20th COVID Crash closing low. Below is a chart showing the rolling 100-trading day percentage change of the Nasdaq 100 since 1985. The 59.8% gain over the last 100 trading days ranks as the 3rd strongest run on record. The only two stronger 100-day rallies ended in January 1999 and March 2000.
(CLICK HERE FOR THE CHART!)
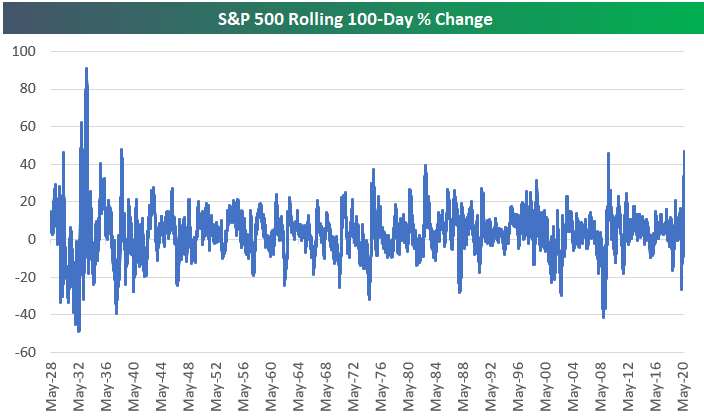
While the Nasdaq 100 bottomed on Friday, March 20th, the S&P 500 bottomed the following Monday (3/23). This means tomorrow will mark 100 trading days since the S&P 500's COVID Crash closing low. Right now the rolling 100-day percentage change for the S&P 500 sits at +46.7%. But if the S&P manages to trade at current levels tomorrow, the 100-day gain will jump above 50%. It has been 87 years (1933) since we've seen a 100-day gain of more than 50%!
(CLICK HERE FOR THE CHART!)
B.I.G. Tips - New Highs In Sight
Whether you want to look at it from the perspective of closing prices or intraday levels, the S&P 500 is doing what just about everybody thought would be impossible less than five months ago - approaching record highs. Relative to its closing high of 3,386.15, the S&P 500 is just 0.27% lower, while it's within half of a percent from its record intraday high of 3,393.52. Through today, the S&P 500 has gone 120 trading days without a record high, and as shown in the chart below, the current streak is barely even visible when viewed in the perspective of all streaks since 1928. Even if we zoom in on just the last five years, the current streak of 120 trading days only ranks as the fourth-longest streak without a new high.
While the S&P 500's 120-trading day streak without a new high isn't extreme by historical standards, the turnaround off the lows has been extraordinary. In the S&P 500's history, there have been ten prior declines of at least 20% from a record closing high. Of those ten prior periods, the shortest gap between the original record high and the next one was 309 trading days, and the shortest gap between highs that had a pullback of at least 30% was 484 tradings days (or more than four times the current gap of 120 trading days). For all ten streaks without a record high, the median drought was 680 trading days.
(CLICK HERE FOR THE CHART!)
Whenever the S&P 500 does take out its 2/19 high, the question is whether the new high represents a breakout where the S&P 500 keeps rallying into evergreen territory, or does it run out of gas after finally reaching a new milestone? To shed some light on this question, we looked at the S&P 500's performance following each prior streak of similar duration without a new high.
STOCK MARKET VIDEO: Stock Market Analysis Video for Week Ending August 14th, 2020
([CLICK HERE FOR THE YOUTUBE VIDEO!]())
(VIDEO NOT YET POSTED!)
STOCK MARKET VIDEO: ShadowTrader Video Weekly 8.16.20
([CLICK HERE FOR THE YOUTUBE VIDEO!]())
(VIDEO NOT YET POSTED!)
Here are the most notable companies (tickers) reporting earnings in this upcoming trading week ahead-
- NOTABLE TICKERS REMOVED DUE TO R/STOCKS AUTO MOD
(CLICK HERE FOR NEXT WEEK'S MOST NOTABLE EARNINGS RELEASES!)
([CLICK HERE FOR NEXT WEEK'S HIGHEST VOLATILITY EARNINGS RELEASES!]())
(N/A)
Below are some of the notable companies coming out with earnings releases this upcoming trading week ahead which includes the date/time of release & consensus estimates courtesy of Earnings Whispers:
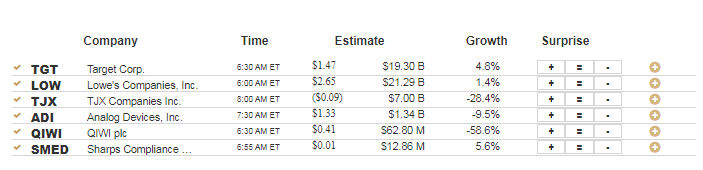
Monday 8.17.20 Before Market Open:
(CLICK HERE FOR MONDAY'S PRE-MARKET EARNINGS TIME & ESTIMATES!)
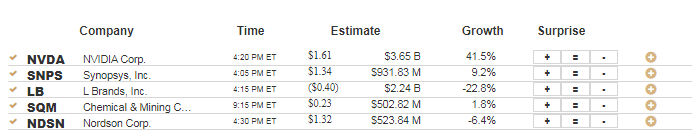
Monday 8.17.20 After Market Close:
(CLICK HERE FOR MONDAY'S AFTER-MARKET EARNINGS TIME & ESTIMATES!)
Tuesday 8.18.20 Before Market Open:
(CLICK HERE FOR TUESDAY'S PRE-MARKET EARNINGS TIME & ESTIMATES!)
Tuesday 8.18.20 After Market Close:
(CLICK HERE FOR TUESDAY'S AFTER-MARKET EARNINGS TIME & ESTIMATES!)
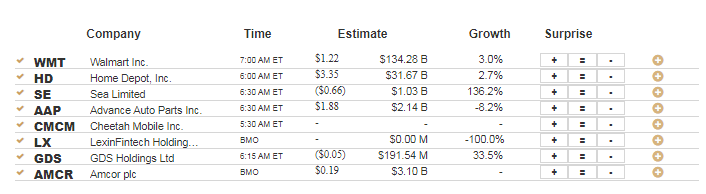
Wednesday 8.19.20 Before Market Open:
(CLICK HERE FOR WEDNESDAY'S PRE-MARKET EARNINGS TIME & ESTIMATES!)
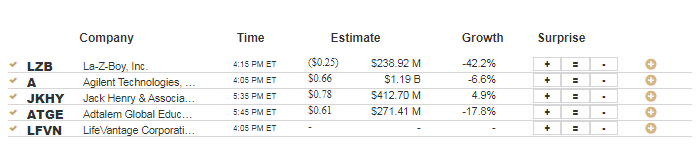
Wednesday 8.19.20 After Market Close:
(CLICK HERE FOR WEDNESDAY'S AFTER-MARKET EARNINGS TIME & ESTIMATES!)
Thursday 8.20.20 Before Market Open:
(CLICK HERE FOR THURSDAY'S PRE-MARKET EARNINGS TIME & ESTIMATES!)
Thursday 8.20.20 After Market Close:
(CLICK HERE FOR THURSDAY'S AFTER-MARKET EARNINGS TIME & ESTIMATES!)
Friday 8.21.20 Before Market Open:
(CLICK HERE FOR FRIDAY'S PRE-MARKET EARNINGS TIME & ESTIMATES!)
Friday 8.21.20 After Market Close:
([CLICK HERE FOR FRIDAY'S AFTER-MARKET EARNINGS TIME & ESTIMATES!]())
(NONE)
Walmart Inc. $132.60
Walmart Inc. (WMT) is confirmed to report earnings at approximately 7:00 AM ET on Tuesday, August 18, 2020. The consensus earnings estimate is $1.20 per share on revenue of $134.28 billion and the Earnings Whisper ® number is $1.29 per share. Investor sentiment going into the company's earnings release has 81% expecting an earnings beat. Consensus estimates are for earnings to decline year-over-year by 5.51% with revenue increasing by 2.99%. Short interest has decreased by 12.5% since the company's last earnings release while the stock has drifted higher by 0.6% from its open following the earnings release to be 9.9% above its 200 day moving average of $120.64. Overall earnings estimates have been revised higher since the company's last earnings release. On Tuesday, August 11, 2020 there was some notable buying of 12,381 contracts of the $135.00 put expiring on Friday, August 21, 2020. Option traders are pricing in a 4.9% move on earnings and the stock has averaged a 2.3% move in recent quarters.
(CLICK HERE FOR THE CHART!)
NVIDIA Corp. $462.56
NVIDIA Corp. (NVDA) is confirmed to report earnings at approximately 4:20 PM ET on Wednesday, August 19, 2020. The consensus earnings estimate is $1.95 per share on revenue of $3.65 billion and the Earnings Whisper ® number is $2.01 per share. Investor sentiment going into the company's earnings release has 84% expecting an earnings beat The company's guidance was for earnings of $1.83 to $2.06 per share. Consensus estimates are for year-over-year earnings growth of 65.25% with revenue increasing by 41.53%. The stock has drifted higher by 31.0% from its open following the earnings release to be 57.7% above its 200 day moving average of $293.24. Overall earnings estimates have been revised higher since the company's last earnings release. On Friday, August 14, 2020 there was some notable buying of 3,787 contracts of the $460.00 call expiring on Friday, August 21, 2020. Option traders are pricing in a 7.7% move on earnings and the stock has averaged a 4.0% move in recent quarters.
(CLICK HERE FOR THE CHART!)
Alibaba Group Holding Ltd. $253.97
Alibaba Group Holding Ltd. (BABA) is confirmed to report earnings at approximately 7:10 AM ET on Thursday, August 20, 2020. The consensus earnings estimate is $1.99 per share on revenue of $21.13 billion and the Earnings Whisper ® number is $2.11 per share. Investor sentiment going into the company's earnings release has 83% expecting an earnings beat. Consensus estimates are for year-over-year earnings growth of 8.74% with revenue increasing by 26.22%. Short interest has increased by 30.1% since the company's last earnings release while the stock has drifted higher by 25.0% from its open following the earnings release to be 20.0% above its 200 day moving average of $211.59. Overall earnings estimates have been revised lower since the company's last earnings release. On Friday, August 7, 2020 there was some notable buying of 12,935 contracts of the $300.00 call expiring on Friday, November 20, 2019. Option traders are pricing in a 6.2% move on earnings and the stock has averaged a 3.1% move in recent quarters.
(CLICK HERE FOR THE CHART!)
JD.com, Inc. $62.06
JD.com, Inc. (JD) is confirmed to report earnings at approximately 5:50 AM ET on Monday, August 17, 2020. The consensus earnings estimate is $0.38 per share on revenue of $26.98 billion and the Earnings Whisper ® number is $0.46 per share. Investor sentiment going into the company's earnings release has 78% expecting an earnings beat. Consensus estimates are for year-over-year earnings growth of 52.00% with revenue increasing by 23.25%. Short interest has increased by 16.7% since the company's last earnings release while the stock has drifted higher by 24.1% from its open following the earnings release to be 36.9% above its 200 day moving average of $45.34. Overall earnings estimates have been revised higher since the company's last earnings release. On Friday, August 14, 2020 there was some notable buying of 12,799 contracts of the $62.00 call expiring on Friday, August 21, 2020. Option traders are pricing in a 8.0% move on earnings and the stock has averaged a 6.4% move in recent quarters.
(CLICK HERE FOR THE CHART!)
Home Depot, Inc. $280.55
Home Depot, Inc. (HD) is confirmed to report earnings at approximately 6:00 AM ET on Tuesday, August 18, 2020. The consensus earnings estimate is $3.71 per share on revenue of $31.67 billion and the Earnings Whisper ® number is $3.75 per share. Investor sentiment going into the company's earnings release has 78% expecting an earnings beat. Consensus estimates are for year-over-year earnings growth of 17.03% with revenue increasing by 2.69%. Short interest has decreased by 39.8% since the company's last earnings release while the stock has drifted higher by 16.7% from its open following the earnings release to be 22.4% above its 200 day moving average of $229.20. Overall earnings estimates have been revised higher since the company's last earnings release. On Friday, August 14, 2020 there was some notable buying of 3,323 contracts of the $300.00 call expiring on Friday, August 28, 2020. Option traders are pricing in a 4.2% move on earnings and the stock has averaged a 2.5% move in recent quarters.
(CLICK HERE FOR THE CHART!)
Lowe's Companies, Inc. $154.34
Lowe's Companies, Inc. (LOW) is confirmed to report earnings at approximately 6:00 AM ET on Wednesday, August 19, 2020. The consensus earnings estimate is $2.93 per share on revenue of $21.29 billion and the Earnings Whisper ® number is $2.97 per share. Investor sentiment going into the company's earnings release has 78% expecting an earnings beat. Consensus estimates are for year-over-year earnings growth of 36.28% with revenue increasing by 1.42%. Short interest has decreased by 19.2% since the company's last earnings release while the stock has drifted higher by 25.9% from its open following the earnings release to be 31.2% above its 200 day moving average of $117.67. Overall earnings estimates have been revised higher since the company's last earnings release. On Friday, August 7, 2020 there was some notable buying of 1,994 contracts of the $170.00 call expiring on Friday, August 21, 2020. Option traders are pricing in a 6.0% move on earnings and the stock has averaged a 5.8% move in recent quarters.
(CLICK HERE FOR THE CHART!)
Target Corp. $136.53
Target Corp. (TGT) is confirmed to report earnings at approximately 6:30 AM ET on Wednesday, August 19, 2020. The consensus earnings estimate is $1.56 per share on revenue of $19.30 billion and the Earnings Whisper ® number is $1.64 per share. Investor sentiment going into the company's earnings release has 75% expecting an earnings beat. Consensus estimates are for earnings to decline year-over-year by 14.29% with revenue increasing by 4.77%. Short interest has decreased by 36.8% since the company's last earnings release while the stock has drifted higher by 10.0% from its open following the earnings release to be 18.0% above its 200 day moving average of $115.73. Overall earnings estimates have been revised higher since the company's last earnings release. On Monday, August 10, 2020 there was some notable buying of 4,479 contracts of the $135.00 call expiring on Friday, September 18, 2020. Option traders are pricing in a 6.3% move on earnings and the stock has averaged a 7.7% move in recent quarters.
(CLICK HERE FOR THE CHART!)
Sea Limited $126.50
Sea Limited (SE) is confirmed to report earnings at approximately 6:30 AM ET on Tuesday, August 18, 2020. The consensus estimate is for a loss of $0.47 per share on revenue of $1.03 billion and the Earnings Whisper ® number is ($0.36) per share. Investor sentiment going into the company's earnings release has 74% expecting an earnings beat. Consensus estimates are for earnings to decline year-over-year by 34.29% with revenue increasing by 136.16%. Short interest has decreased by 8.5% since the company's last earnings release while the stock has drifted higher by 91.7% from its open following the earnings release to be 98.1% above its 200 day moving average of $63.87. Overall earnings estimates have been revised lower since the company's last earnings release. On Tuesday, August 4, 2020 there was some notable buying of 4,000 contracts of the $110.00 put expiring on Friday, January 15, 2019. Option traders are pricing in a 12.9% move on earnings and the stock has averaged a 16.7% move in recent quarters.
(CLICK HERE FOR THE CHART!)
Niu Technologies $20.82
Niu Technologies (NIU) is confirmed to report earnings at approximately 3:00 AM ET on Monday, August 17, 2020. The consensus earnings estimate is $0.07 per share on revenue of $88.07 million and the Earnings Whisper ® number is $0.11 per share. Investor sentiment going into the company's earnings release has 57% expecting an earnings beat. Consensus estimates are for earnings to decline year-over-year by 30.00% with revenue increasing by 13.97%. Short interest has increased by 18.9% since the company's last earnings release while the stock has drifted higher by 129.8% from its open following the earnings release to be 90.3% above its 200 day moving average of $10.94. Overall earnings estimates have been revised higher since the company's last earnings release. The stock has averaged a 3.7% move on earnings in recent quarters.
(CLICK HERE FOR THE CHART!)
BJ's Wholesale Club, Inc. $41.48
BJ's Wholesale Club, Inc. (BJ) is confirmed to report earnings at approximately 6:45 AM ET on Thursday, August 20, 2020. The consensus earnings estimate is $0.57 per share on revenue of $3.64 billion and the Earnings Whisper ® number is $0.60 per share. Investor sentiment going into the company's earnings release has 73% expecting an earnings beat. Consensus estimates are for year-over-year earnings growth of 46.15% with revenue increasing by 8.79%. Short interest has decreased by 3.2% since the company's last earnings release while the stock has drifted higher by 33.8% from its open following the earnings release to be 46.7% above its 200 day moving average of $28.27. Overall earnings estimates have been revised higher since the company's last earnings release. On Wednesday, August 12, 2020 there was some notable buying of 2,119 contracts of the $50.00 call expiring on Friday, September 18, 2020. Option traders are pricing in a 12.4% move on earnings and the stock has averaged a 10.0% move in recent quarters.
(CLICK HERE FOR THE CHART!)
DISCUSS!
What are you all watching for in this upcoming trading week?
I hope you all have a wonderful weekend and a great trading week ahead r/stocks.
submitted by /u/bigbear0083
[comments]
Source link
5,045,564.
That's how many cases the US officially has (not that we are counting). 162,938 Americans are dead, that's much harder to cover up. Globally we are about to cross 20M cases at 19,877,261 with 731,570 deaths so the US has more than 25% of the global cases and 22% of the deaths - despite having just 3.7% of the population so Trump is right - America is leading the world by a factor of 6 - no one transmits the virus or dies from the virus like we do! MAGA!!!
The markets don't seem to mind and we're still up around record highs as the worst things are for the American people, the better things are for American Corporations, apparently, as the stimulus fairy comes and pays them visit after visit. President Trump played the fairy this weekend, waving his executive action wand and unconstitutionally wishing for various bribes to the voters:
- $400/week supplement to unemployment checks (states need to pay for it and Federal supplement comes from Disaster Fund that's meant for hurricanes, etc).
- Suspend payments on Student Loans through 12/31 (but not the interest).
- Extend eviction protection through 12/31 (the courts can't handle the backlog anyway)
- Defer Payroll Taxes through 12/31 (a disaster for the Social Security and Medicare System and also puts a huge tax burden on the employees at the end of the year they are unlikely to manage for, which will be blamed on Biden as a tax increase, of course)
In other words, Trump's Executive Orders are a whole lot of nothing but Congress and the White House have still failed to reconcile Democrats' $3.4Tn coronavirus-relief plan and Senate Republicans' far smaller $1.1Tn proposal. The Paycheck Protection Program expired Saturday. The future of the small business rescue plan is in limbo. “Meet us halfway and work together to deliver immediate relief to the American people,” Pelosi and Schumer said in a joint statement. “Lives are being lost, and time is of the essence.”
Joe Biden, noting that Trump signed the “half-baked” orders at his golf club in New Jersey, said they short-change the unemployed and trigger a “new, reckless war on Social Security." “These orders are not real solutions,” soon to be President Biden said. “They
…

-
 Business4 weeks ago
Bernice King, Ava DuVernay reflect on the legacy of John Lewis
-
World News3 weeks ago
Heavy rain threatens flood-weary Japan, Korean Peninsula
-
 Technology3 weeks ago
Everything New On Netflix This Weekend: July 25, 2020
-
Finance3 months ago
Will Equal Weighted Index Funds Outperform Their Benchmark Indexes?
-
Marketing Strategies7 months ago
Top 20 Workers’ Compensation Law Blogs & Websites To Follow in 2020
-
 World News7 months ago
The West Blames the Wuhan Coronavirus on China’s Love of Eating Wild Animals. The Truth Is More Complex
-
Economy10 months ago
Newsletter: Jobs, Consumers and Wages
-
 Finance8 months ago
$95 Grocery Budget + Weekly Menu Plan for 8