Economy
Six Graphs Showing Just How Much the Government Has Grown
Federal spending and federal taxation in the United States set new records in 2019. And the federal budget deficit swelled to more than a trillion dollars. Europe is in the middle of an enormous spending binge. But apparently hard-core laissez-faire libertarian purists have taken over the world’s governments.
At least, that’s the case in the minds of many leftists and conservatives who have convinced themselves that “market fundamentalists” have conquered the world’s institutions, and have enacted a global regime of near-zero taxation, free trade, and almost totally unregulated markets.
We hear this over an over again when everyone from The Pope to Bernie Sanders claims “neoliberalism” — a term used to “denote… a radical, far-reaching application of free-market economics unprecedented in speed, scope, or ambition” — has forged the world into a paradise for radical libertarians.
As one writer at The Guardian assures us, the UK must end the nation’s “generation-long experiment in market fundamentalism.” Meanwhile, Tucker Carlson insists that American policymakers “worship” markets and have a near-religious devotion to capitalism.
The neoliberal takeover is so complete, in fact, that we’re told neoliberals are the ones really running the Labour Party. Meanwhile, sociologist Lawrence Busch informs us of a “neoliberal takeover” of higher education. “Free-market fundamentalists,” Busch contends, have transformed America’s colleges and universities into swamps of capitalist obeisance.
By What Metric?
But whenever I hear about how government intervention in the marketplace is withering away — to be replaced by untrammeled markets — I am forced to wonder what metric these people are using.
By what measure are governments getting smaller, weaker, and less involved in the daily lives of human beings?
In this country, at least, this case certainly can’t be made by consulting the data on government taxation and spending.
From 1960 to 2018, federal tax receipts per capita increased from $3,523 to $5,973, an increase of 70 percent.
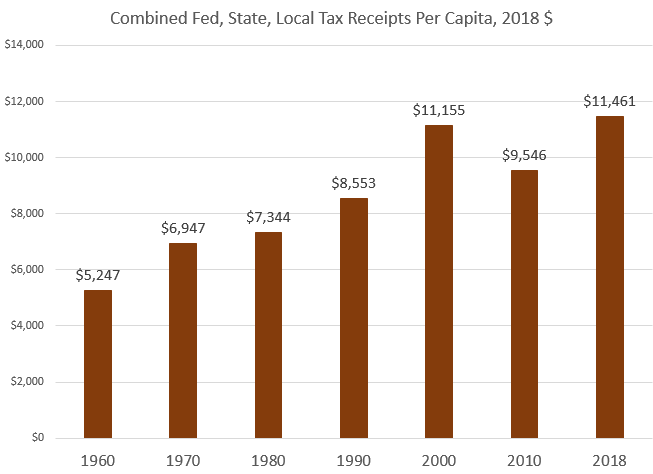
Combining state and local taxation with federal taxes, the increase is even larger. Taxation per capita at all levels combined grew 118 percent from $5,247 in 1960 to $11,461 in 2018.
The size and scope of government isn’t just growing to reflect population changes. After all, the US population only grew 81 percent from 1960 to 2018. And the federal government, embroiled in a global cold war amidst a rising tide of social programs, wasn’t exactly vanishingly small in 1960.
In all these per capita graphs, I’ve factored in population growth because many defenders of government growth claim that governments must get larger as populations increase. Even if that were true, we can see that total spending and taxation is outpacing population growth considerably.1 But it should not simply be accepted that population growth ought to bring increases in government spending and taxation. Military defense of the United States doesn’t become more expensive simply because the population grew. Moreover, innovation and productivity gains make products and services less expensive in a functioning private economy. This is often masked by relentless money supply inflation in the name of price “stability.” But the natural progression of an economy is toward falling prices. Only with government procurements have we come to expect everything getting more expensive every year.
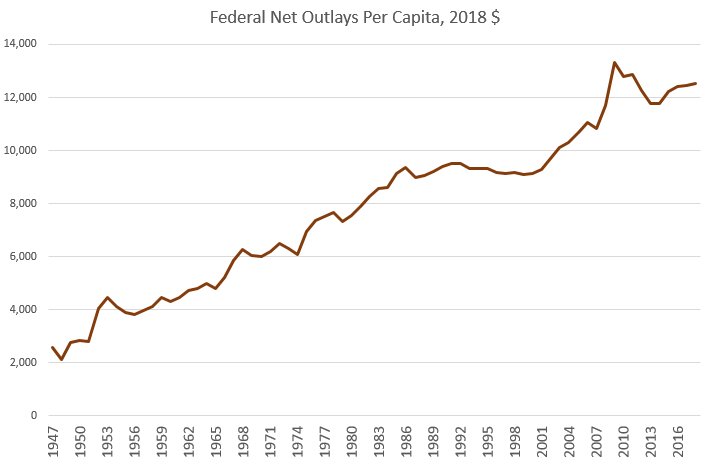
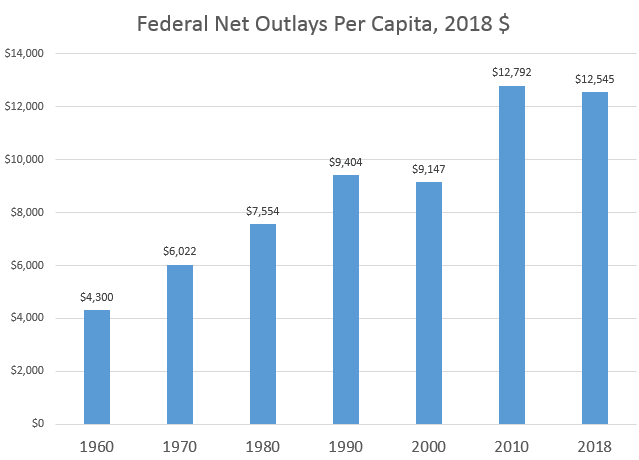
Fueled by huge deficits, federal spending has outpaced tax collections. Per capita federal spending increased by 191 percent from 1960 to 2018, climbing from $4,300 to $12,545.
The deficit topped a trillion dollars during the 2019 fiscal year, a new high for a so-called “boom period” during which deficits are supposed to shrink.
Ultimately, of course, huge deficits will put an additional burden on the taxpayers beyond the hundreds of billions of dollars per year necessary to simply pay interest on the debt. The huge debt levels put upward pressure on interest rates, and require more central-bank interventions designed to prop up demand for government debt. These interventions both crowd out demand for private debt, and have led to asset-price inflation as a result of money-supply inflation. This benefits the wealthy, but harms first time home buyers and ordinary savers.
The government spending itself is a problem as well. Governments try to play off government spending as if it were all a free gift to the taxpayers as some sort of “return” on the “investment” of taxes paid.
As Murray Rothbard has noted, however, government spending is just as damaging as the taxation that came before it. Government procurements bid up the prices of goods and services that could have been available at lower prices in the private sector were it not for the government spending. Steel and other materials would be less expensive for entrepreneurs. High tech workers could be employed innovating and making things for ordinary taxpayers instead of for government agencies and bureaucrats. Small business owners and ordinary consumers all are worse off as a result.
So, given that spending and taxation are at or are near all-time highs right now, where exactly is this takeover by laissez-faire libertarians we keep hearing about?
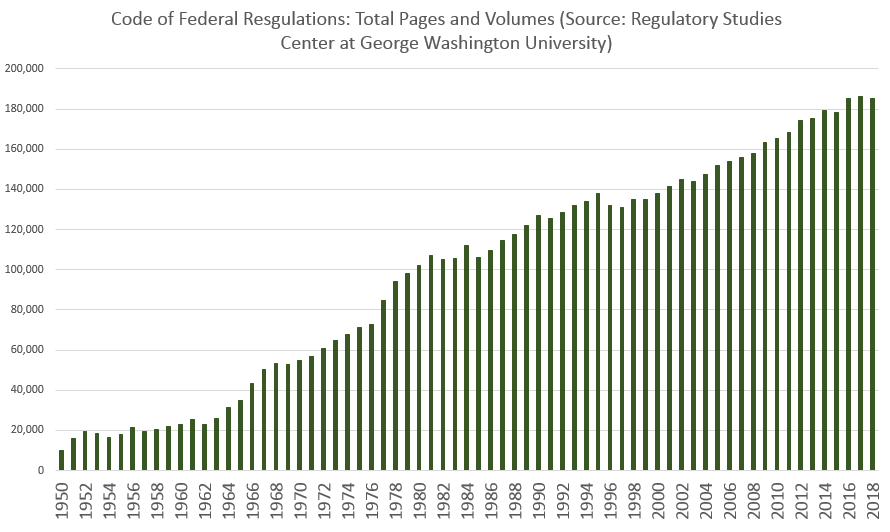
It’s certainly not in the regulatory side of the government.
The number of pages published in the Code of Federal Regulations increased 710 percent from 1960 to 2018, and 37 percent over the past twenty years. Every additional page represents new regulations, new rules, new punishments, and new fees. These are costs employers must contend with, and consumers must ultimately pay for. Protectionists who think that manufacturers would flock to the United States were it not not low tariffs might consider the regulatory burden placed on employers by our own domestic policies.
Both staffing and budgets for federal regulatory agencies continue to balloon. The combined budgets for federal regulatory agencies have more than tripled over the past 40 years, rising from under 20 billion in 1978 to 65 billion today.
Part of this has been to pay salaries for the ever growing army of federal employees. Employees at regulatory agencies doubled over the past forty years, rising from 140,000 full-time equivalent positions in 1978 to 280,000 today.
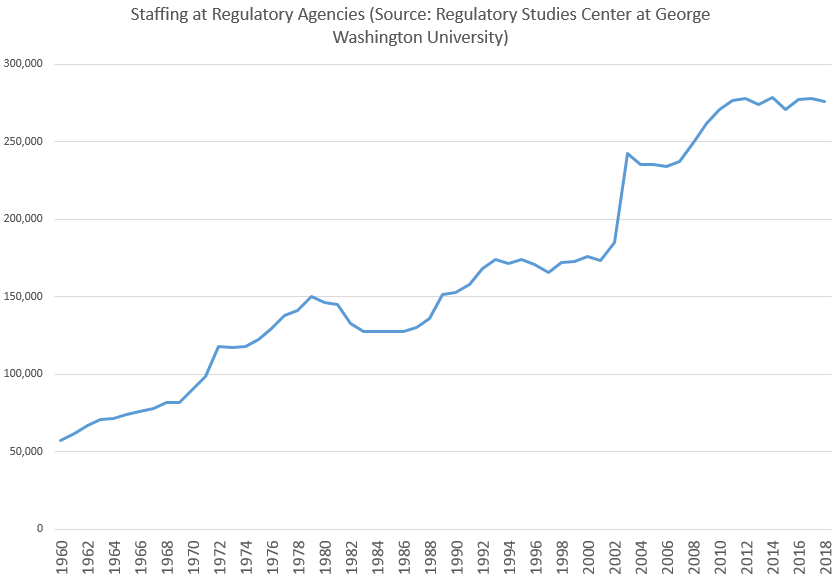
The US population increased by 47 percent during that time.
When the federal government isn’t spending more, it’s taking on more risk, committing the taxpayers to more bailouts, and flooding the market with government insured debt. As The Washington Post reported earlier this month, “In 2019, there is more government-backed housing debt than at any other point in U.S. history.” And these government guarantees are up considerably since the 2009 housing crash. The Post continues: “Now, Fannie Mae, Freddie Mac and the Federal Housing Administration guarantee almost $7 trillion in mortgage-related debt, 33% more than before the housing crisis … Because these entities are run or backstopped by the U.S. government, a large increase in loan defaults could cost taxpayers hundreds of billions of dollars.”
Yet, in spite of all this, we’ll no doubt continue to be told that government is withering away, government institutions are “underfunded,” and extreme anti-government libertarians have taken over. Of course, it’s entirely possible that the success of certain free-market ideas — however limited that success may be — has helped to restrain the growth of government taxation and spending. Without this so-called “victory” of the libertarians, we might be looking at a per capita tax burden that grew 200 or 300 percent in recent decades, rather than a “mere” 118 percent.
But given the ongoing growth of government taxation, spending, and regulation, it should be abundantly clear that we are hardly living in an age of “market fundamentalism,” laissez-faire libertarianism, or policymakers who “worship” the market. If anything, trends appear to be moving in exactly the opposite direction.
- 1. One factor in rising tax collections during the twentieth century was the increase in the number of women who became wage earners. Wages, of course, are taxable, while in-kind or cottage-type income earned in household work is generally not taxable. As women left the home, they were more easily taxed. This trend, however, peaked in the 1990s, and the proportion of the workforce that is women now is about equal to what it was in the early 1990s. Per capita tax collections have continued to increase since the 1990s nonetheless.
My new book, “How To Make The World Add Up“, is published today in the UK and around the world (except US/Canada).
Will this year be 1954 all over again? Forgive me, I have become obsessed with 1954, not because it offers another example of a pandemic (that was 1957) or an economic disaster (there was a mild US downturn in 1953), but for more parochial reasons. Nineteen fifty-four saw the appearance of two contrasting visions for the world of statistics — visions that have shaped our politics, our media and our health. This year confronts us with a similar choice.
The first of these visions was presented in How to Lie with Statistics, a book by a US journalist named Darrell Huff. Brisk, intelligent and witty, it is a little marvel of numerical communication. The book received rave reviews at the time, has been praised by many statisticians over the years and is said to be the best-selling work on the subject ever published. It is also an exercise in scorn: read it and you may be disinclined to believe a number-based claim ever again.
There are good reasons for scepticism today. David Spiegelhalter, author of last year’s The Art of Statistics, laments some of the UK government’s coronavirus graphs and testing targets as “number theatre”, with “dreadful, awful” deployment of numbers as a political performance.
“There is great damage done to the integrity and trustworthiness of statistics when they’re under the control of the spin doctors,” Spiegelhalter says. He is right. But we geeks must be careful — because the damage can come from our own side, too.
For Huff and his followers, the reason to learn statistics is to catch the liars at their tricks. That sceptical mindset took Huff to a very unpleasant place, as we shall see. Once the cynicism sets in, it becomes hard to imagine that statistics could ever serve a useful purpose.
But they can — and back in 1954, the alternative perspective was embodied in the publication of an academic paper by the British epidemiologists Richard Doll and Austin Bradford Hill. They marshalled some of the first compelling evidence that smoking cigarettes dramatically increases the risk of lung cancer. The data they assembled persuaded both men to quit smoking and helped save tens of millions of lives by prompting others to do likewise. This was no statistical trickery, but a contribution to public health that is almost impossible to exaggerate.
You can appreciate, I hope, my obsession with these two contrasting accounts of statistics: one as a trick, one as a tool. Doll and Hill’s painstaking approach illuminates the world and saves lives into the bargain. Huff’s alternative seems clever but is the easy path: seductive, addictive and corrosive. Scepticism has its place, but easily curdles into cynicism and can be weaponised into something even more poisonous than that.
The two worldviews soon began to collide. Huff’s How to Lie with Statistics seemed to be the perfect illustration of why ordinary, honest folk shouldn’t pay too much attention to the slippery experts and their dubious data. Such ideas were quickly picked up by the tobacco industry, with its darkly brilliant strategy of manufacturing doubt in the face of evidence such as that provided by Doll and Hill.
As described in books such as Merchants of Doubt by Erik Conway and Naomi Oreskes, this industry perfected the tactics of spreading uncertainty: calling for more research, emphasising doubt and the need to avoid drastic steps, highlighting disagreements between experts and funding alternative lines of inquiry. The same tactics, and sometimes even the same personnel, were later deployed to cast doubt on climate science. These tactics are powerful in part because they echo the ideals of science. It is a short step from the Royal Society’s motto, “nullius in verba” (take nobody’s word for it), to the corrosive nihilism of “nobody knows anything”.
So will 2020 be another 1954? From the point of view of statistics, we seem to be standing at another fork in the road. The disinformation is still out there, as the public understanding of Covid-19 has been muddied by conspiracy theorists, trolls and government spin doctors. Yet the information is out there too. The value of gathering and rigorously analysing data has rarely been more evident. Faced with a complete mystery at the start of the year, statisticians, scientists and epidemiologists have been working miracles. I hope that we choose the right fork, because the pandemic has lessons to teach us about statistics — and vice versa — if we are willing to learn.
1: The numbers matter
“One lesson this pandemic has driven home to me is the unbelievable importance of the statistics,” says Spiegelhalter. Without statistical information, we haven’t a hope of grasping what it means to face a new, mysterious, invisible and rapidly spreading virus. Once upon a time, we would have held posies to our noses and prayed to be spared; now, while we hope for advances from medical science, we can also coolly evaluate the risks.
Without good data, for example, we would have no idea that this infection is 10,000 times deadlier for a 90-year-old than it is for a nine-year-old — even though we are far more likely to read about the deaths of young people than the elderly, simply because those deaths are surprising. It takes a statistical perspective to make it clear who is at risk and who is not.
Good statistics, too, can tell us about the prevalence of the virus — and identify hotspots for further activity. Huff may have viewed statistics as a vector for the dark arts of persuasion, but when it comes to understanding an epidemic, they are one of the few tools we possess.
2: Don’t take the numbers for granted
But while we can use statistics to calculate risks and highlight dangers, it is all too easy to fail to ask the question “Where do these numbers come from?” By that, I don’t mean the now-standard request to cite sources, I mean the deeper origin of the data.
For all his faults, Huff did not fail to ask the question. He retells a cautionary tale that has become known as “Stamp’s Law” after the economist Josiah Stamp — warning that no matter how much a government may enjoy amassing statistics, “raise them to the nth power, take the cube root and prepare wonderful diagrams”, it was all too easy to forget that the underlying numbers would always come from a local official, “who just puts down what he damn pleases”.
The cynicism is palpable, but there is insight here too. Statistics are not simply downloaded from an internet database or pasted from a scientific report. Ultimately, they came from somewhere: somebody counted or measured something, ideally systematically and with care. These efforts at systematic counting and measurement require money and expertise — they are not to be taken for granted.
In my new book, How to Make the World Add Up, I introduce the idea of “statistical bedrock” — data sources such as the census and the national income accounts that are the results of painstaking data collection and analysis, often by official statisticians who get little thanks for their pains and are all too frequently the target of threats, smears or persecution.
In Argentina, for example, long-serving statistician Graciela Bevacqua was ordered to “round down” inflation figures, then demoted in 2007 for producing a number that was too high. She was later fined $250,000 for false advertising — her crime being to have helped produce an independent estimate of inflation.
In 2011, Andreas Georgiou was brought in to head Greece’s statistical agency at a time when it was regarded as being about as trustworthy as the country’s giant wooden horses. When he started producing estimates of Greece’s deficit that international observers finally found credible, he was prosecuted for his “crimes” and threatened with life imprisonment. Honest statisticians are braver — and more invaluable — than we know.
In the UK, we don’t habitually threaten our statisticians — but we do underrate them.
“The Office for National Statistics is doing enormously valuable work that frankly nobody has ever taken notice of,” says Spiegelhalter, pointing to weekly death figures as an example. “Now we deeply appreciate it.”
Quite so. This statistical bedrock is essential, and when it is missing, we find ourselves sinking into a quagmire of confusion.
The foundations of our statistical understanding of the world are often gathered in response to a crisis. For example, nowadays we take it for granted that there is such a thing as an “unemployment rate”, but a hundred years ago nobody could have told you how many people were searching for work. Severe recessions made the question politically pertinent, so governments began to collect the data. More recently, the financial crisis hit. We discovered that our data about the banking system was patchy and slow, and regulators took steps to improve it.
So it is with the Sars-Cov-2 virus. At first, we had little more than a few data points from Wuhan, showing an alarmingly high death rate of 15 per cent — six deaths in 41 cases. Quickly, epidemiologists started sorting through the data, trying to establish how exaggerated that case fatality rate was by the fact that the confirmed cases were mostly people in intensive care.
Quirks of circumstance — such as the Diamond Princess cruise ship, in which almost everyone was tested — provided more insight. Johns Hopkins University in the US launched a dashboard of data resources, as did the Covid Tracking Project, an initiative from the Atlantic magazine. An elusive and mysterious threat became legible through the power of this data. That is not to say that all is well.
Nature recently reported on “a coronavirus data crisis” in the US, in which “political meddling, disorganization and years of neglect of public-health data management mean the country is flying blind”. Nor is the US alone. Spain simply stopped reporting certain Covid deaths in early June, making its figures unusable. And while the UK now has an impressively large capacity for viral testing, it was fatally slow to accelerate this in the critical early weeks of the pandemic. Ministers repeatedly deceived the public about the number of tests being carried out by using misleading definitions of what was happening. For weeks during lockdown, the government was unable to say how many people were being tested each day.
Huge improvements have been made since then. The UK’s Office for National Statistics has been impressively flexible during the crisis, for example in organising systematic weekly testing of a representative sample of the population. This allows us to estimate the true prevalence of the virus. Several countries, particularly in east Asia, provide accessible, usable data about recent infections to allow people to avoid hotspots.
These things do not happen by accident: they require us to invest in the infrastructure to collect and analyse the data. On the evidence of this pandemic, such investment is overdue, in the US, the UK and many other places.
3: Even the experts see what they expect to see
Jonas Olofsson, a psychologist who studies our perceptions of smell, once told me of a classic experiment in the field. Researchers gave people a whiff of scent and asked them for their reactions to it. In some cases, the experimental subjects were told: “This is the aroma of a gourmet cheese.” Others were told: “This is the smell of armpits.” In truth, the scent was both: an aromatic molecule present both in runny cheese and in bodily crevices. But the reactions of delight or disgust were shaped dramatically by what people expected.
Statistics should, one would hope, deliver a more objective view of the world than an ambiguous aroma. But while solid data offers us insights we cannot gain in any other way, the numbers never speak for themselves. They, too, are shaped by our emotions, our politics and, perhaps above all, our preconceptions. There is great damage done to the integrity and trustworthiness of statistics when they’re under the control of the spin doctors
A striking example is the decision, on March 23 this year, to introduce a lockdown in the UK. In hindsight, that was too late. “Locking down a week earlier would have saved thousands of lives,” says Kit Yates, author of The Maths of Life and Death — a view now shared by influential epidemiologist Neil Ferguson and by David King, chair of the “Independent Sage” group of scientists.
The logic is straightforward enough: at the time, cases were doubling every three to four days. If a lockdown had stopped that process in its tracks a week earlier, it would have prevented two doublings and saved three-quarters of the 65,000 people who died in the first wave of the epidemic, as measured by the excess death toll.
That might be an overestimate of the effect, since people were already voluntarily pulling back from social interactions. Yet there is little doubt that if a lockdown was to happen at all, an earlier one would have been more effective. And, says Yates, since the infection rate took just days to double before lockdown but long weeks to halve once it started, “We would have got out of lockdown so much sooner . . . Every week before lockdown cost us five to eight weeks at the back end of the lockdown.”
Why, then, was the lockdown so late? No doubt there were political dimensions to that decision, but senior scientific advisers to the government seemed to believe that the UK still had plenty of time. On March 12, prime minister Boris Johnson was flanked by Chris Whitty, the government’s chief medical adviser, and Patrick Vallance, chief scientific adviser, in the first big set-piece press conference.
Italy had just suffered its 1,000th Covid death and Vallance noted that the UK was about four weeks behind Italy on the epidemic curve. With hindsight, this was wrong: now that late-registered deaths have been tallied, we know that the UK passed the same landmark on lockdown day, March 23, just 11 days later. It seems that in early March the government did not realise how little time it had.
As late as March 16, Johnson declared that infections were doubling every five to six days. The trouble, says Yates, is that UK data on cases and deaths suggested that things were moving much faster than that, doubling every three or four days — a huge difference. What exactly went wrong is unclear — but my bet is that it was a cheese-or-armpit problem. Some influential epidemiologists had produced sophisticated models suggesting that a doubling time of five to six days seemed the best estimate, based on data from the early weeks of the epidemic in China.
These models seemed persuasive to the government’s scientific advisers, says Yates: “If anything, they did too good a job.” Yates argues that the epidemiological models that influenced the government’s thinking about doubling times were sufficiently detailed and convincing that when the patchy, ambiguous, early UK data contradicted them, it was hard to readjust. We all see what we expect to see.
The result, in this case, was a delay to lockdown: that led to a much longer lockdown, many thousands of preventable deaths and needless extra damage to people’s livelihoods. The data is invaluable but, unless we can overcome our own cognitive filters, the data is not enough.
4: The best insights come from combining statistics with personal experience
The expert who made the biggest impression on me during this crisis was not the one with the biggest name or the biggest ego. It was Nathalie MacDermott, an infectious-disease specialist at King’s College London, who in mid-February calmly debunked the more lurid public fears about how deadly the new coronavirus was. Then, with equal calm, she explained to me that the virus was very likely to become a pandemic, that barring extraordinary measures we could expect it to infect more than half the world’s population, and that the true fatality rate was uncertain but seemed to be something between 0.5 and 1 per cent. In hindsight, she was broadly right about everything that mattered.
MacDermott’s educated guesses pierced through the fog of complex modelling and data-poor speculation. I was curious as to how she did it, so I asked her.
“People who have spent a lot of their time really closely studying the data sometimes struggle to pull their head out and look at what’s happening around them,” she said. “I trust data as well, but sometimes when we don’t have the data, we need to look around and interpret what’s happening.”
MacDermott worked in Liberia in 2014 on the front line of an Ebola outbreak that killed more than 11,000 people. At the time, international organisations were sanguine about the risks, while the local authorities were in crisis. When she arrived in Liberia, the treatment centres were overwhelmed, with patients lying on the floor, bleeding freely from multiple areas and dying by the hour.
The horrendous experience has shaped her assessment of subsequent risks: on the one hand, Sars-Cov-2 is far less deadly than Ebola; on the other, she has seen the experts move too slowly while waiting for definitive proof of a risk.
“From my background working with Ebola, I’d rather be overprepared than underprepared because I’m in a position of denial,” she said.
There is a broader lesson here. We can try to understand the world through statistics, which at their best provide a broad and representative overview that encompasses far more than we could personally perceive. Or we can try to understand the world up close, through individual experience. Both perspectives have their advantages and disadvantages.
Muhammad Yunus, a microfinance pioneer and Nobel laureate, has praised the “worm’s eye view” over the “bird’s eye view”, which is a clever sound bite. But birds see a lot too. Ideally, we want both the rich detail of personal experience and the broader, low-resolution view that comes from the spreadsheet. Insight comes when we can combine the two — which is what MacDermott did.
5: Everything can be polarised
Reporting on the numbers behind the Brexit referendum, the vote on Scottish independence, several general elections and the rise of Donald Trump, there was poison in the air: many claims were made in bad faith, indifferent to the truth or even embracing the most palpable lies in an effort to divert attention from the issues. Fact-checking in an environment where people didn’t care about the facts, only whether their side was winning, was a thankless experience.
For a while, one of the consolations of doing data-driven journalism during the pandemic was that it felt blessedly free of such political tribalism. People were eager to hear the facts after all; the truth mattered; data and expertise were seen to be helpful. The virus, after all, could not be distracted by a lie on a bus.
That did not last. America polarised quickly, with mask-wearing becoming a badge of political identity — and more generally the Democrats seeking to underline the threat posed by the virus, with Republicans following President Trump in dismissing it as overblown. The prominent infectious-disease expert Anthony Fauci does not strike me as a partisan figure — but the US electorate thinks otherwise. He is trusted by 32 per cent of Republicans and 78 per cent of Democrats.
The strangest illustration comes from the Twitter account of the Republican politician Herman Cain, which late in August tweeted: “It looks like the virus is not as deadly as the mainstream media first made it out to be.” Cain, sadly, died of Covid-19 in July — but it seems that political polarisation is a force stronger than death.
Not every issue is politically polarised, but when something is dragged into the political arena, partisans often prioritise tribal belonging over considerations of truth. One can see this clearly, for example, in the way that highly educated Republicans and Democrats are further apart on the risks of climate change than less-educated Republicans and Democrats. Rather than bringing some kind of consensus, more years of education simply seem to provide people with the cognitive tools they require to reach the politically convenient conclusion. From climate change to gun control to certain vaccines, there are questions for which the answer is not a matter of evidence but a matter of group identity.
In this context, the strategy that the tobacco industry pioneered in the 1950s is especially powerful. Emphasise uncertainty, expert disagreement and doubt and you will find a willing audience. If nobody really knows the truth, then people can believe whatever they want.
All of which brings us back to Darrell Huff, statistical sceptic and author of How to Lie with Statistics. While his incisive criticism of statistical trickery has made him a hero to many of my fellow nerds, his career took a darker turn, with scepticism providing the mask for disinformation. Huff worked on a tobacco-funded sequel, How to Lie with Smoking Statistics, casting doubt on the scientific evidence that cigarettes were dangerous. (Mercifully, it was not published.)
Huff also appeared in front of a US Senate committee that was pondering mandating health warnings on cigarette packaging. He explained to the lawmakers that there was a statistical correlation between babies and storks (which, it turns out, there is) even though the true origin of babies is rather different. The connection between smoking and cancer, he argued, was similarly tenuous.
Huff’s statistical scepticism turned him into the ancestor of today’s contrarian trolls, spouting bullshit while claiming to be the straight-talking voice of common sense. It should be a warning to us all.
There is a place in anyone’s cognitive toolkit for healthy scepticism, but that scepticism can all too easily turn into a refusal to look at any evidence at all.
This crisis has reminded us of the lure of partisanship, cynicism and manufactured doubt. But surely it has also demonstrated the power of honest statistics. Statisticians, epidemiologists and other scientists have been producing inspiring work in the footsteps of Doll and Hill. I suggest we set aside How to Lie with Statistics and pay attention.
Carefully gathering the data we need, analysing it openly and truthfully, sharing knowledge and unlocking the puzzles that nature throws at us — this is the only chance we have to defeat the virus and, more broadly, an essential tool for understanding a complex and fascinating world.
Written for and published by the FT Magazine on 10 September 2020.
My new book, “How To Make The World Add Up“, is published today in the UK and around the world (except US/Canada).
Nominal GDP targeting has been advocated in a recent Joint Economic Committee report “Stable Monetary Policy to Connect More Americans to Work”.
The best anchor for monetary policy decisions is nominal income or nominal spending—the amount of money people receive or pay out, which more or less equal out economy-wide. Under an ideal monetary regime, spending should not be too scarce (characterized by low investment and employment), but nor should it be too plentiful (characterized by high and increasing inflation). While this balance may be easier to imagine than to achieve, this report argues that stabilizing general expectations about the level of nominal income or nominal spending in the economy best allows the private sector to value individual goods and services in the context of that anchored expectation, and build long-term contracts with a reasonable degree of certainty. This target could also be understood as steady growth in the money supply, adjusted for the private sector’s ability to circulate that money supply faster or slower.
One challenge to implementation is the relatively large revisions in the growth rate of this variable (and don’t get me started on the level). Here’s an example from our last recession.
Figure 1: Q/Q nominal GDP growth, SAAR, from various vintages. NBER defined recession dates shaded gray. Source: ALFRED.
How big are the revisions? The BEA provides a detailed description. This table summarizes the results.
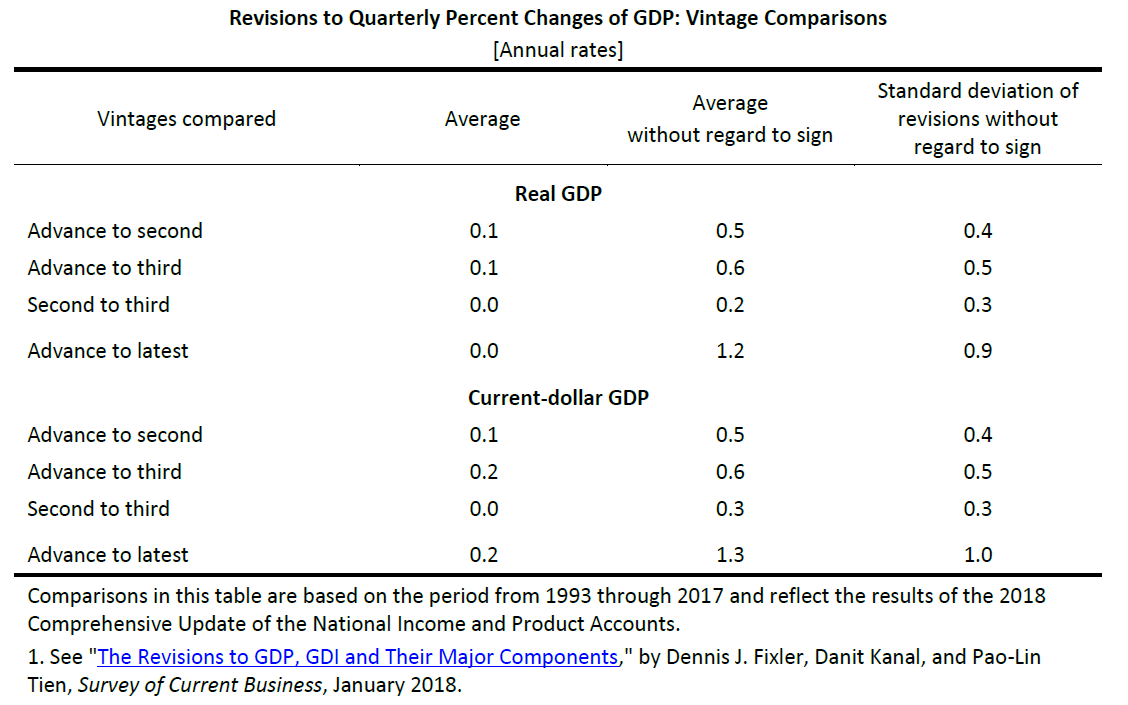
The standard deviation of revisions going from Advance to Latest is one percent (annualized), mean absolute revision is 1.3 percent. Now, the Latest Vintage might not be entirely relevant for policy, so lets look at Advance to Third revision standard deviation of 0.5 percent (0.6 percent mean absolute). That’s through 2017. From the advance to 2nd release, 2020Q2 GDP growth went from -42.1% to -40.5% (log terms).
Compare against the personal consumption expenditure deflator, at the monthly — not quarterly — frequency; the mean absolute revision is 0.5 percent going from Advance to Third. The corresponding figure for Core PCE is 0.35 percent. Perhaps this is why the Fed focused more on price/inflation targets, i.e.:
…variants of so-called makeup strategies, “so called” because they at times require the Committee to deliberately target rates of inflation that deviate from 2 percent on one side so as to make up for times that inflation deviated from 2 percent on the other side. Price-level targeting (PLT) is a useful benchmark among makeup policies but also represents a more significant and perhaps undesirable departure from the flexible inflation-targeting framework compared with other alternatives. “Nearer neighbors” to flexible inflation targeting are more flexible variants of PLT, which include temporary PLT—that is, use of PLT only around ELB episodes to offset persistently low inflation—and average inflation targeting (AIT), including one-sided AIT, which only restores inflation to a 2 percent average when it has been below 2 percent, and AIT that limits the degree of reversal for overshooting and undershooting the inflation target.10
Admittedly, the estimation of output gap is fraught with much larger (in my opinion) measurement challenges than the trend in nominal GDP, as it compounds the problems of real GDP measurement and potential GDP estimation; this is a point made by Beckworth and Hendrickson (JMCB, 2019). Even use of the unemployment rate, which can be substituted for the output gap in the Taylor principle by way of Okun’s Law, encounters a problem. As Aruoba (2008) notes, the unemployment rate is not subject to large and/or biased revisions; however the estimated natural rate of unemployment, on the other hand, does change over time, as estimated by CBO by Fed, and others, so there is going to be revision to the implied unemployment gap (this point occupies a substantial portion of JEC report). Partly for this reason, the recently announced modification of the Fed’s policy framework stresses shortfalls rather than deviations, discussed in this post.
One interesting aspect of the debate over nominal GDP targeting relates to growth rates vs. levels. If it’s growth rates (as in Beckworth and Hendrickson (JMCB, 2019), there is generally a “fire and forget” approach to setting rates. An actual nominal GDP target of the level implies that past errors are not forgotten (McCallum, 2001) (this is not a distinction specific to GDP as we know from the inflation vs. price level debate). Targeting the level of nominal GDP faces another — perhaps even more problematic — challenge, as suggested by Figure 2.
Figure 2: Nominal GDP in billions of current dollars, SAAR, from various vintages. NBER defined recession dates shaded gray. Dashed red line at annual benchmark revisions. Red arrows denote implied revisions to last overlapping observation between two benchmarked series. Source: ALFRED.
Revisions can be large at benchmark revisions, shown as dashed lines in the above Figure. But even nonbenchmark revision can be large, as in 2009Q3. ( Beckworth (2019) suggests using a Survey of Professional Forecasters forecast relative to target and a level gap as means of addressing this issue — I think — insofar as the target can be moved relative to current vintage.)
None of the foregoing should be construed as a comprehensive case against some form of nominal GDP targeting — after all Frankel with Chinn (JMCB, 1995) provides some arguments in favor. But it suggests that the issue of data revisions in the conduct of monetary policy is not inconsequential.
The American Prospect
Vice President Joe Biden was angry. It was 2013, and Ron Klain, his trusted chief of staff, was leaving for the private sector. Biden needed someone dependable to replace him during the second term. But David Plouffe, President Obama’s campaign guru and top political adviser, kept shooting down his picks. First, he vetoed Kevin Sheekey, an adviser to then–New York Mayor Michael Bloomberg, out of fear he’d be too loyal to the financier-oligarch. Biden conceded, and instead suggested Steve Ricchetti.
Ricchetti, a longtime political operative, was at the time the founder and chairman of the powerful lobbying firm Ricchetti, Inc. Though he hadn’t personally registered as a lobbyist in years, he did give the marching orders to a team of hired guns for the most powerful industries in America, including extensive ties to Big Pharma.
Plouffe didn’t budge. “The Ricchetti pick also was killed,” Glenn Thrush reported for Politico Magazine at the time, “in part because Plouffe said his background violated the president’s no-lobbyists pledge—but mostly because Ricchetti was deemed to be too chummy with the Clintons and too much of a ‘free agent’ who would look after Biden’s interests first.”
This enraged Biden. Who was Plouffe, a man 24 years his junior, to tell him what to do? “He [Biden] appealed directly to Obama, who initially deferred to Plouffe’s judgment,” Thrush reports. “Biden pressed Obama harder, arguing that he ‘needed to have his own people to do this job,’ as one aide briefed on the interaction put it. Obama finally assented—with the caveat that Biden had ‘to keep Steve from coloring outside of the lines.’”
Progressives need only to hear the name “Rahm Emanuel” to remember the stakes of this job.
That fight was over seven years ago. Ricchetti kept the job as Biden’s chief of staff throughout the second term. In 2014, Plouffe, who was so wary of bad optics on corporate power, revolved out to lobby for Uber, and now represents Mark Zuckerberg. Today, Ricchetti co-chairs Biden’s presidential campaign, and is well positioned to resume his role as Biden’s chief of staff in the White House, should his boss vanquish Donald Trump in November. If this happens, a man who has always argued against Biden’s best instincts, and a lifelong enemy of the progressive movement, will be the chief gatekeeper to the president’s desk.
The White House chief of staff is the single most powerful non-Senate-confirmed job in the federal executive branch. It typically involves managing the president’s schedule, deciding which of his advisers get face time with him, and giving marching orders for any day-to-day work that the president doesn’t personally oversee.
Progressives need only to hear the name “Rahm Emanuel” to remember the stakes of this job. As Obama’s first chief of staff, Emanuel kneecapped efforts to even propose a federal stimulus that matched the scale of the Great Recession, and constantly pushed the administration to make up the difference by hurting the most vulnerable. (Anyone remember “Fuck the UAW”?)
Ricchetti may be subtler and smarter than “Rahmbo,” but he would be no less of a threat if placed in charge of the Biden White House. More than just cussing out organized labor, Ricchetti’s career highlight was deliberately undermining it: He led Bill Clinton’s effort to pass permanent normal trade relations (PNTR) with China in 2000, which economists predicted at the time would cause massive blue-collar job loss. Research since has concluded that PNTR directly led to the manufacturing collapse, and that the affected (largely union) workers were unable to re-skill in the way traditional trade theory suggests they would.
At the time, only 28 percent of the public supported normalized trade with China, while a staggering 56 percent opposed it. A separate poll found 79 percent of Americans felt the country should only normalize trade with China after it improved its human rights record and labor standards. None of this dissuaded Ricchetti from pushing PNTR through Congress by any means necessary.
As Biden rightly calls out Donald Trump’s contempt for democracy on the campaign trail, he should consider what it would mean to put someone so dismissive of the popular will in charge of his own White House. Moreover, his “Build Back Better” economic agenda hinges on revitalizing American manufacturing. Why would he trust the man who helped crush manufacturing in the first place to accomplish that?
Given the clients that both Ricchettis are willing to take on, it’s perhaps unsurprising that Steve has been the Biden campaign’s ace in the hole when it comes to high-dollar fundraising.
And then there are Ricchetti’s ties to the most hated industry in America, Big Pharma. Biden has pivoted to an aggressive plan for lowering prescription drug prices, a problem on which GOP voters, Nancy Pelosi, and Alexandria Ocasio-Cortez are all united. He has vowed to repeal the law that prohibits negotiation with drug companies under Medicare, limit launch prices that set a high baseline for prescription drugs, confine price increases to the rate of inflation, and accelerate the development of generics. What message would it send about the seriousness of this plan for Biden’s right-hand man to have personally represented Novartis, Eli Lilly, and Sanofi?
Just last night, news broke that Ricchetti, Inc. has signed on to lobby on behalf of two pharmaceutical companies, Horizon Pharma and GlaxoSmithKline. This is on top of the firm’s longstanding relationship with Japanese pharmaceutical giant Eisai, whom Steve Ricchetti’s brother Jeff, co-founder of the lobbying firm, personally represents. Big Pharma clearly knows that their route into sabotaging Biden’s prescription-drug agenda runs through Steve Ricchetti. The right’s propaganda machine would have a field day with such a glaring conflict of interest. If Biden grants Ricchetti a senior job, he’d give Tucker Carlson a free attack line grounded in actually legitimate complaints.
Given the clients that both Ricchettis are willing to take on, it’s perhaps unsurprising that Steve has been the Biden campaign’s ace in the hole when it comes to high-dollar fundraising. Early on, he sold private conversations with himself as an incentive to wealthy donors, and has given backroom pitches to Wall Street executives. When Biden’s campaign was flailing in January, Ricchetti was personally “imploring bundlers to gather as much money as possible,” according to The New York Times.
Cleverly, Ricchetti has pushed Biden toward opposing support from super PACs, even as he cozies up to the wealthy donors who make super PACs so odious and gets them to donate to Biden directly. By spurning the best-known means of big-money corruption, but not big-money corruption per se, Ricchetti can create an appearance of concern for the public interest without meaningfully changing his tactics.
Ricchetti’s comfort around the ultra-wealthy is probably one of his biggest assets to the Biden campaign. Journalist George Packer writes that Biden used to denigrate his fundraising aide Jeff Connaughton because “Biden hated fund-raising, the drudgery and compromises it entailed. He resented any demands placed on him by the people who helped him raise money and the people who wrote checks, as if he couldn’t stand owing them.” (For his part, Connaughton went on to author the angry confessional The Payoff: Why Wall Street Always Wins, where he writes, “I came to D.C. a Democrat and left a plutocrat.”)
Biden bragged for decades about being one of the poorest men in Congress. His disdain for D.C. glad-handing meant that from day one, onlookers predicted Biden would struggle with funding a national presidential campaign—and sure enough, Biden for President, Inc., was running on fumes in January when Ricchetti told bundlers to dig deep.
Left to his own instincts, Biden seems likelier to chat with the shrimp cocktail waiter than the banker at a fancy fundraising event. Biden may have been a centrist standard-bearer over the decades, but he was never an ideological one—he just knows which way the wind is blowing.
That’s why the minders who shape the president’s thinking—and most especially, the chief of staff who controls their access to him—are so immensely powerful. They literally control which policies and ideas the president gets to see. Imagine how differently history might have gone if Obama had known Christina Romer’s estimate that the country needed $1.8 trillion of stimulus in 2009, information which his future chief of staff Rahm Emanuel pushed to restrict from his ears?
We now face an economic downturn that dwarfs the Great Recession, and it’s just one of a dozen interlinked crises. True, the Biden campaign is claiming that they’ve learned the lessons of history about a too-small stimulus. But it’s terrifying to think that a man who has spun through the revolving door between the White House and K Street three separate times might guide Biden through fights with his former benefactors in Big Pharma over a coronavirus vaccine, with Big Oil over a climate plan, and with corporate boardrooms around the world over rebuilding domestic industry.
Progressives may be able to persuade a President Biden on many issues if they can just sit down to talk with him, but they’ll need to get through the door first. That won’t be doable if Ricchetti is the doorman. Biden should do himself a favor and keep him out of the loop.
The post Biden’s Big Test: Selecting a White House Chief of Staff appeared first on Center for Economic and Policy Research.

-
 Business2 months ago
Bernice King, Ava DuVernay reflect on the legacy of John Lewis
-
World News2 months ago
Heavy rain threatens flood-weary Japan, Korean Peninsula
-
 Technology2 months ago
Everything New On Netflix This Weekend: July 25, 2020
-
Finance4 months ago
Will Equal Weighted Index Funds Outperform Their Benchmark Indexes?
-
Marketing Strategies9 months ago
Top 20 Workers’ Compensation Law Blogs & Websites To Follow in 2020
-
 World News8 months ago
The West Blames the Wuhan Coronavirus on China’s Love of Eating Wild Animals. The Truth Is More Complex
-
Economy11 months ago
Newsletter: Jobs, Consumers and Wages
-
 Finance9 months ago
$95 Grocery Budget + Weekly Menu Plan for 8